
Gold Coiled Into a Running Triangle. One More Leg Lower to Finish It.

The setup — in one line
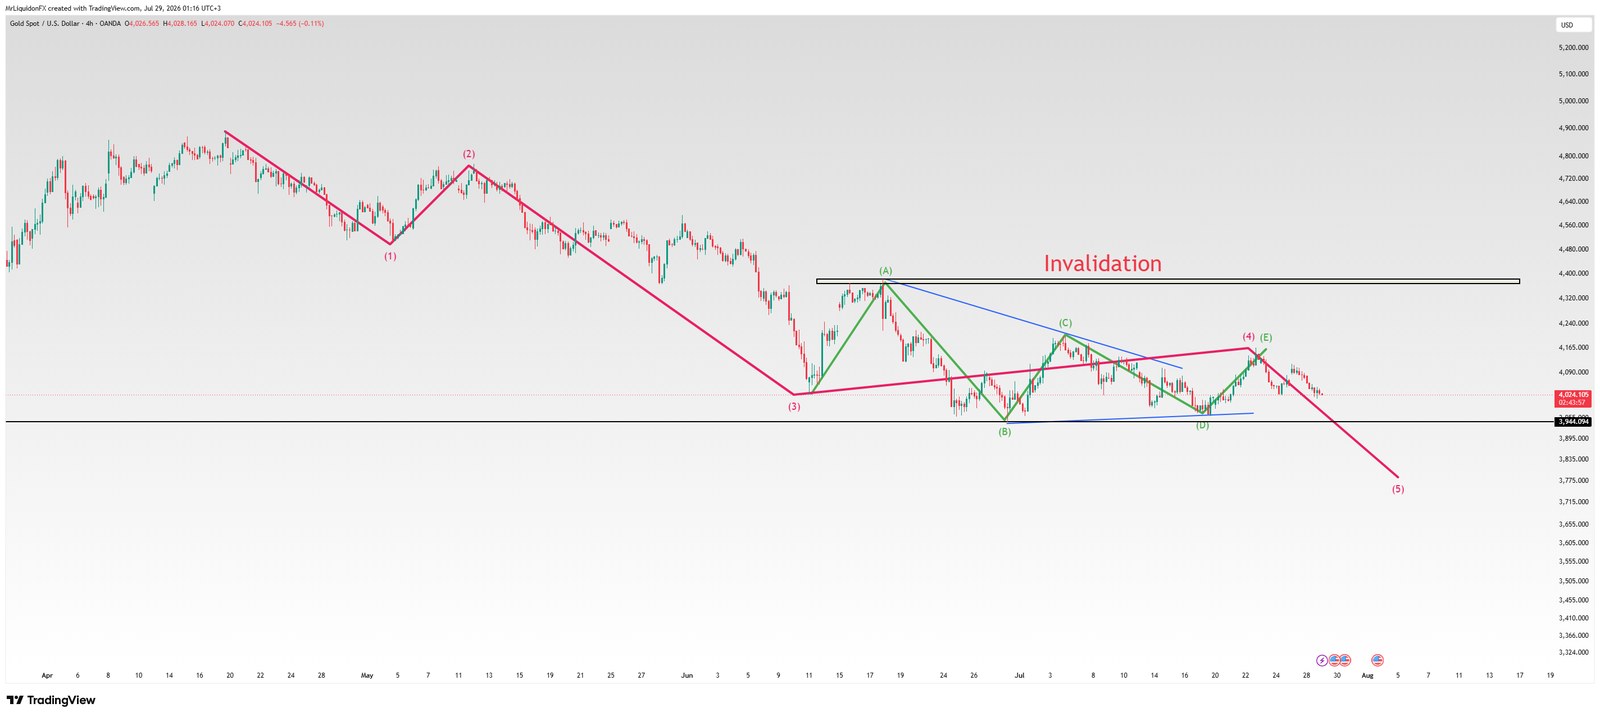
Bearish while price holds below 4,165 — a running wave (4) triangle looks complete near the (E) high, and a break under 3,944 opens the final wave (5) thrust into the 3,800–3,700 zone.
Timeframe: 2H · Bias: Bearish below 4,165.
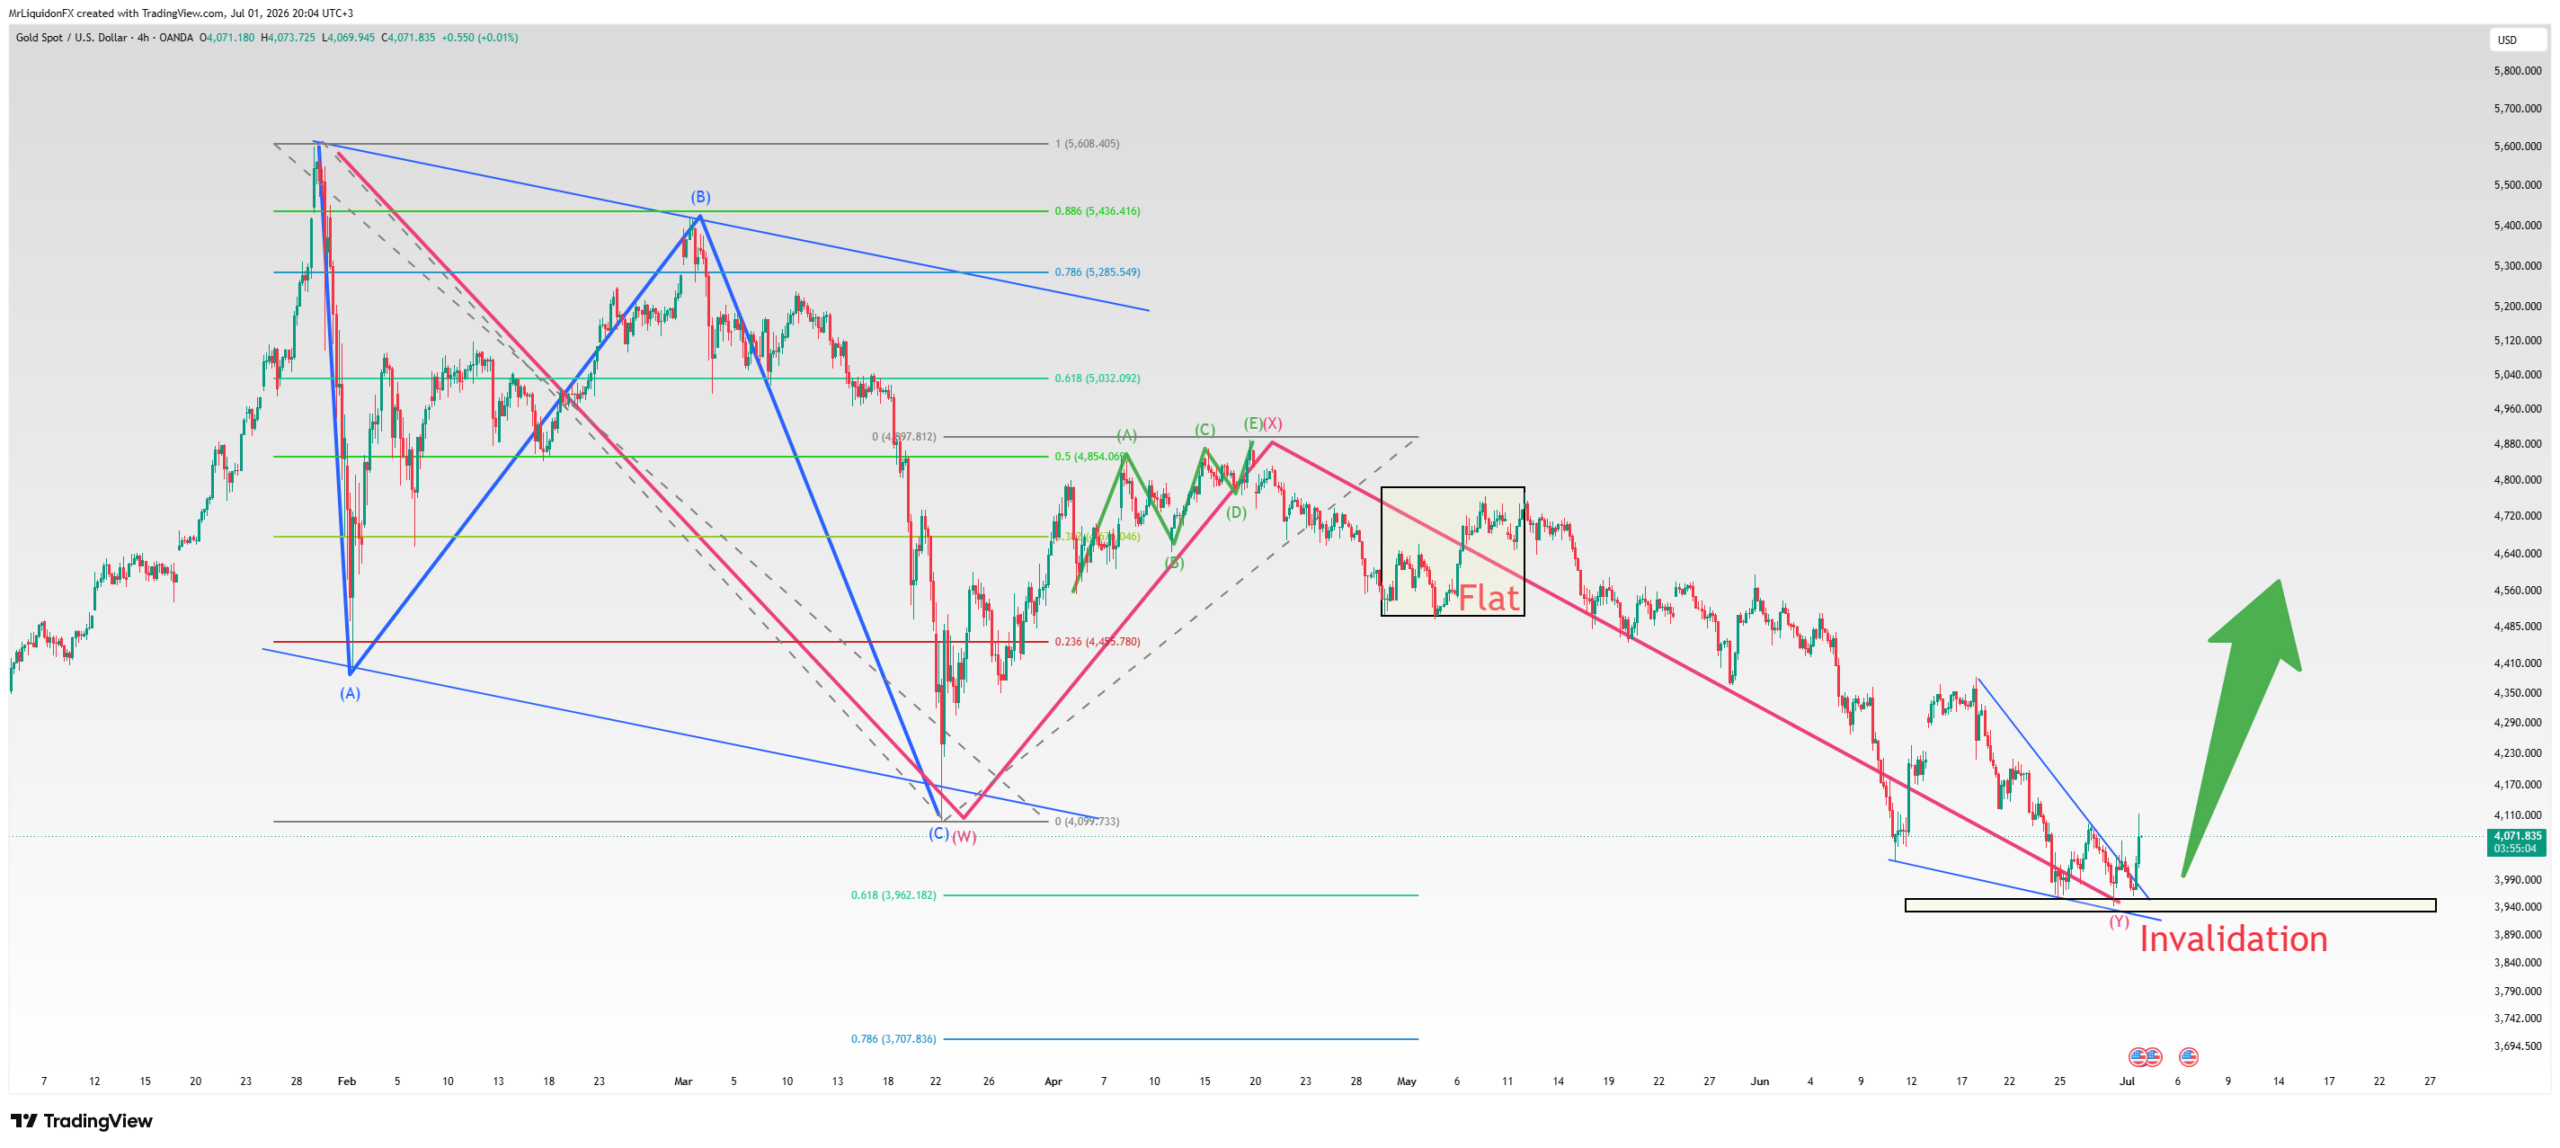
Back in June my scenario on gold was patient longs out of the demand zone — one more dip, then an impulsive move higher on confirmation. I’ll be honest: that confirmation never came, and what the market did instead is the whole reason I’m posting today.
Rather than buyers stepping in, gold went sideways and coiled. For roughly seven weeks price compressed between about 3,944 and 4,165 in five overlapping swings, each smaller than the last. At first glance that’s a wave (4) contracting triangle after the strong, extended decline from 4,915. But look closer at wave (B).
Why this is a running triangle, not a plain one
The triangle begins at the wave (3) low near 4,030. Wave (A) then rallies to ~4,400, and wave (B) sells off to ~3,944 — below where the triangle started. That “running” of the B-leg past the origin is the defining feature of a running triangle. The rest of the structure follows the bearish running template cleanly:
- (A) ~4,400 → high
- (B) ~3,944 → the deepest low, running below the origin
- (C) ~4,200 → lower high
- (D) ~3,975 → higher low than B
- (E) ~4,165 → lower high
Two things make me trust the count:
- Alternation. The earlier wave (2) in this decline was a sharp, deep retracement — so by the rule of alternation I’d expect wave (4) to be its opposite: slow, sideways, time-consuming. A seven-week triangle fits perfectly.
- Position. Triangles form before the final motive wave — exactly where a wave (4) belongs, ahead of wave (5).
And here’s the part that matters most: a running triangle is a sign of trend strength. Wave (B) refusing to hold and running past the triangle’s origin tells me the dominant force — down — is powerful. That typically produces a firm thrust once the pattern resolves.
What I’m watching
The coil looks complete around 4,165 and price has rolled back under 4,030. If sellers keep control below the range floor near 3,944, my scenario is one more impulsive leg lower to finish the structure. Where several of my projections cluster:
- Wave (5) ≈ wave (1) equality → ~3,735
- Triangle thrust (widest width ~456 pts from the E reversal) → ~3,710
- Deeper extension if the thrust stretches → toward ~3,620
That gives a projection zone of roughly 3,800–3,700, with the tightest confluence around 3,735–3,710. Because running triangles signal strength, I’d give the thrust room to reach — or slightly overshoot — the measured objective rather than fall short.
Where I’m wrong
Above 4,400 the contracting structure breaks and this count is simply invalid. I don’t defend a broken count — I drop it and re-read the chart.
The honest lesson
This is exactly why I stepped aside from the June longs instead of forcing them. The setup never confirmed, price went nowhere, and waiting cost me nothing. That patience is the position.
The other side
I always keep an alternative. The whole drop from 4,915 could be corrective, not impulsive — a bottoming structure rather than a reload for one more leg down. Both counts hinge on the same line:
- Below 3,944 → bearish thrust into 3,800–3,700
- Back above 4,165 → the bottoming case comes alive, eyes on 4,400+
One level settles it. Until then I wait.
As always — this is a scenario, not a prediction. Price confirmation comes first. Capital preservation is also a position.
Follow for live wave counts.
Intraday updates, key-level alerts, and direct access — published the moment structure earns it.
Educational content only. Not financial advice. This is my personal read of the structure — wait for confirmation in the zone and respect the invalidation.
Disclaimer: Not Financial Advice
The content provided on WXYwaves is for educational and informational purposes only. It should not be construed as professional financial advice. Trading financial markets involves a high degree of risk and is not suitable for all investors. You could lose some or all of your initial investment.
Disclaimer: Not Financial Advice
The content provided on WXYwaves is for educational and informational purposes only. It should not be construed as professional financial advice. Trading financial markets involves a high degree of risk and is not suitable for all investors. You could lose some or all of your initial investment.