Possible Wave C in motion. Wave B reads as the triangle.
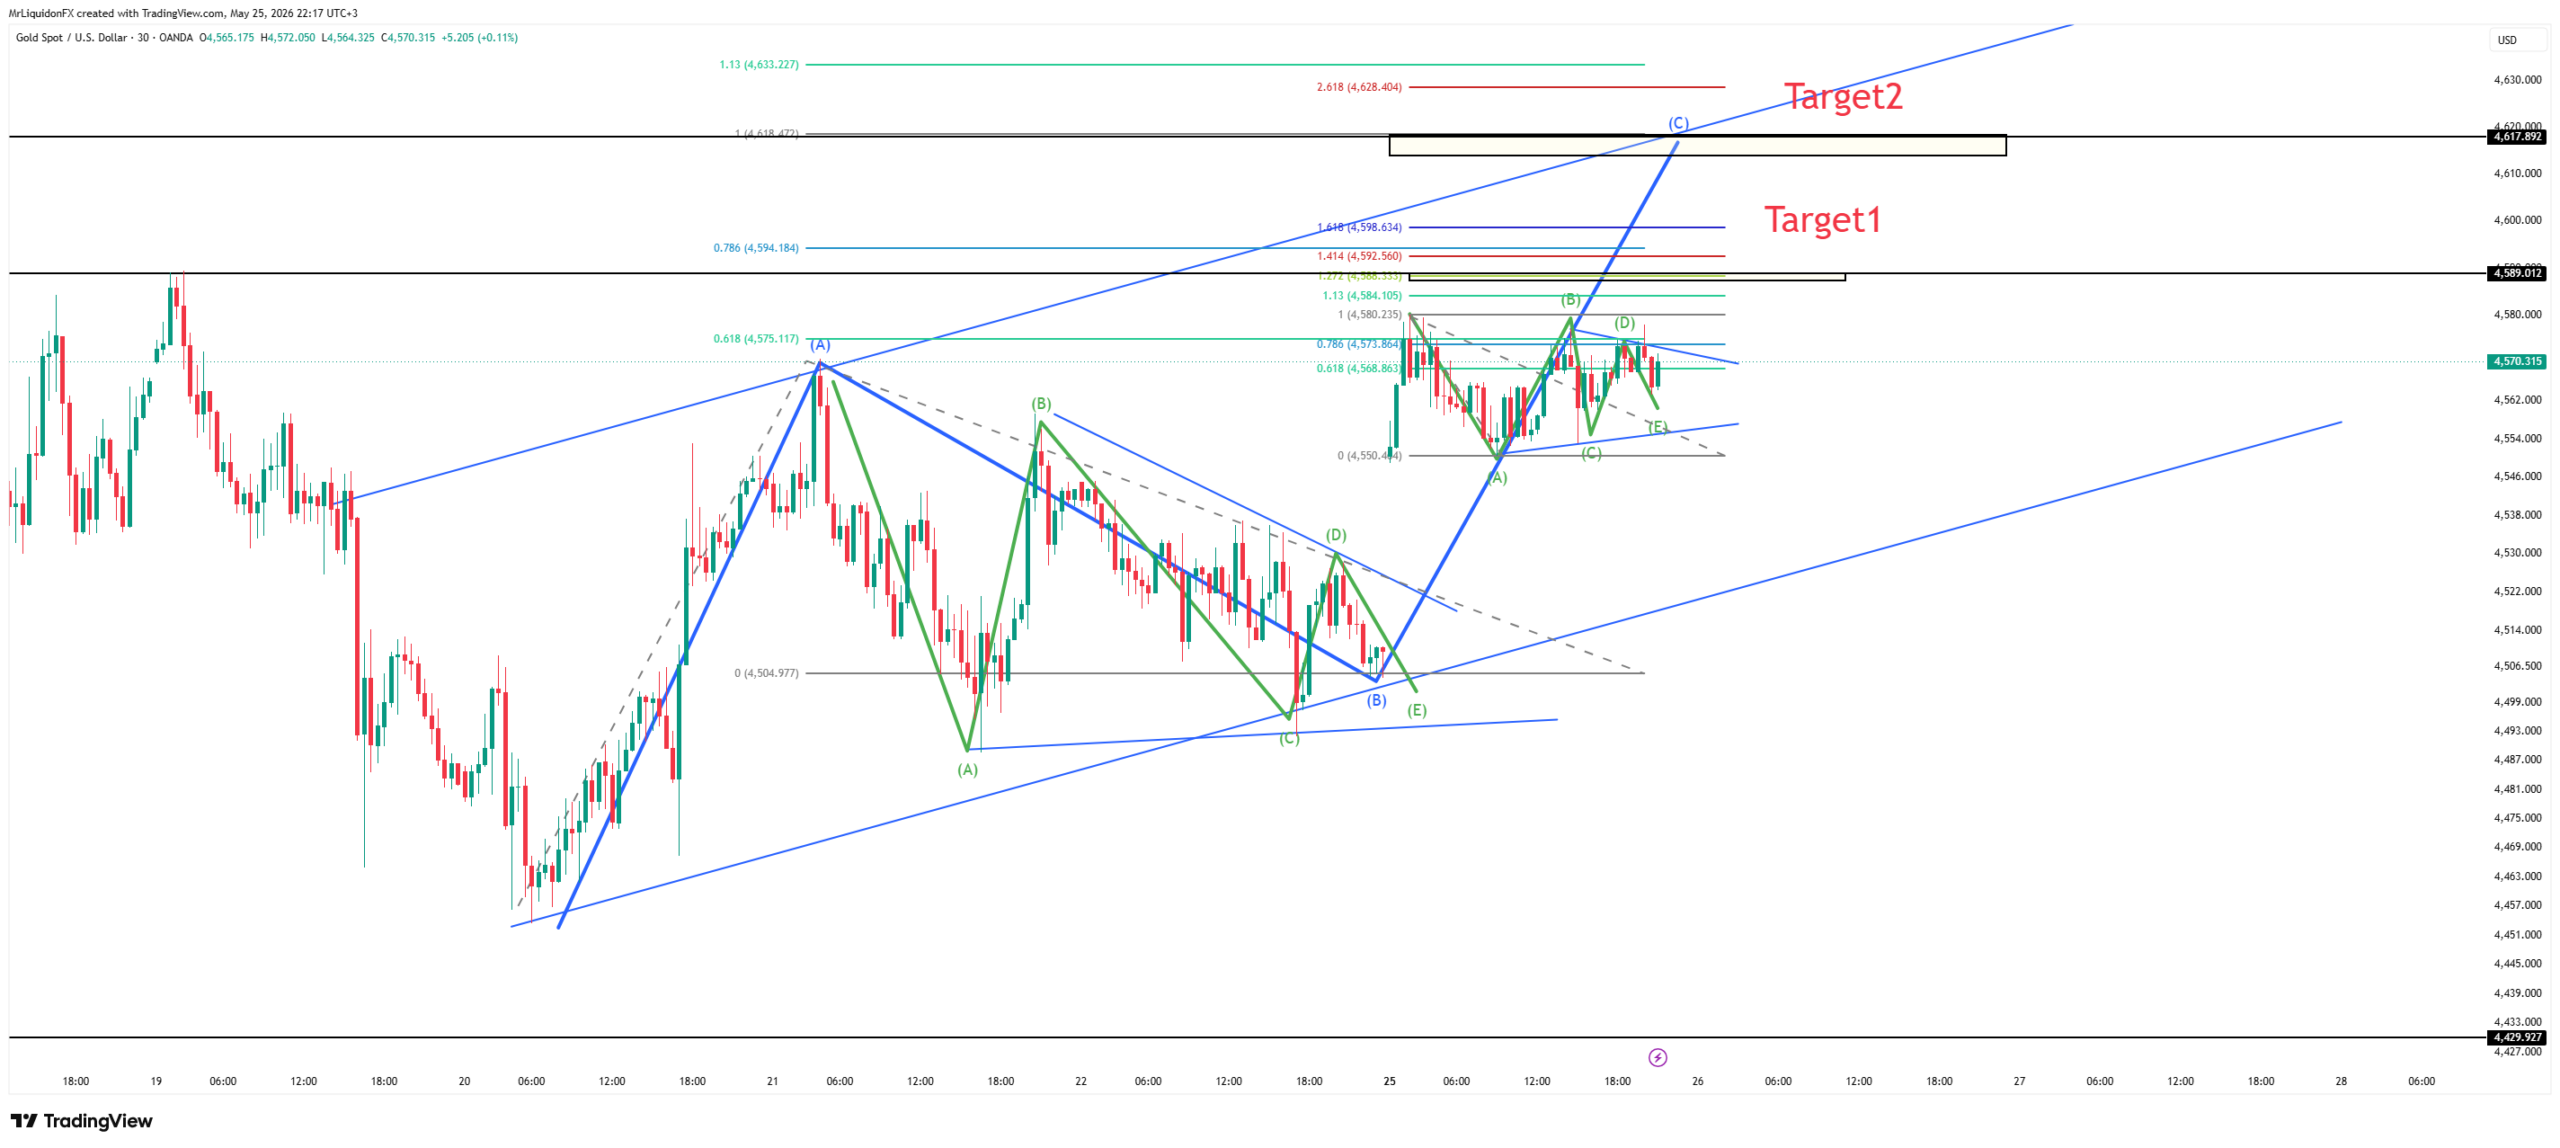
Based on the current wave count, gold is possibly unfolding the C-wave of a corrective structure to the upside. The larger triangle visible on the chart possibly reads as the Wave B consolidation — its breakout would mark the start of Wave C, which appears to be progressing toward the projected targets.
The ongoing geopolitical uncertainty surrounding Iran continues to create hesitation in the market, resulting in compression and ranging behavior rather than a clean impulsive move.
Follow for live wave counts.
Intraday updates, key-level alerts, and direct access — published the moment structure earns it.
Disclaimer: Not Financial Advice
The content provided on WXYwaves is for educational and informational purposes only. It should not be construed as professional financial advice. Trading financial markets involves a high degree of risk and is not suitable for all investors. You could lose some or all of your initial investment.