RiskLogged · Desktop journal for MT5 · First cohort opening
Trading discipline, decoded.
The desktop journal that catches you about to revenge-trade — and stops it before the loss is real.
Get on the list →The problem
Most traders don’t lose to the market. They lose to themselves.
After hours of sleep deprivation. After two losing trades that “should have worked.” After a system signal got ignored for a discretionary one. The journal entry — if it ever gets written — comes after the damage. RiskLogged moves the journal upstream of the trade, so the discipline shows up where it actually matters: before you click.
THE PATTERN
Revenge trading
Position size doubles after a loss. Hold times shrink. The next trade gets opened in 90 seconds. Most journals catch this in the weekly review — too late.
THE PATTERN
Sleep-deprived clicks
Three hours of sleep. A perfectly valid setup. Your win rate on under-six-hours days is half your normal. You knew this and traded anyway.
THE PATTERN
Journal skipped
You write the entry tomorrow. Tomorrow becomes next week. By then the lesson is gone. The cycle compounds.
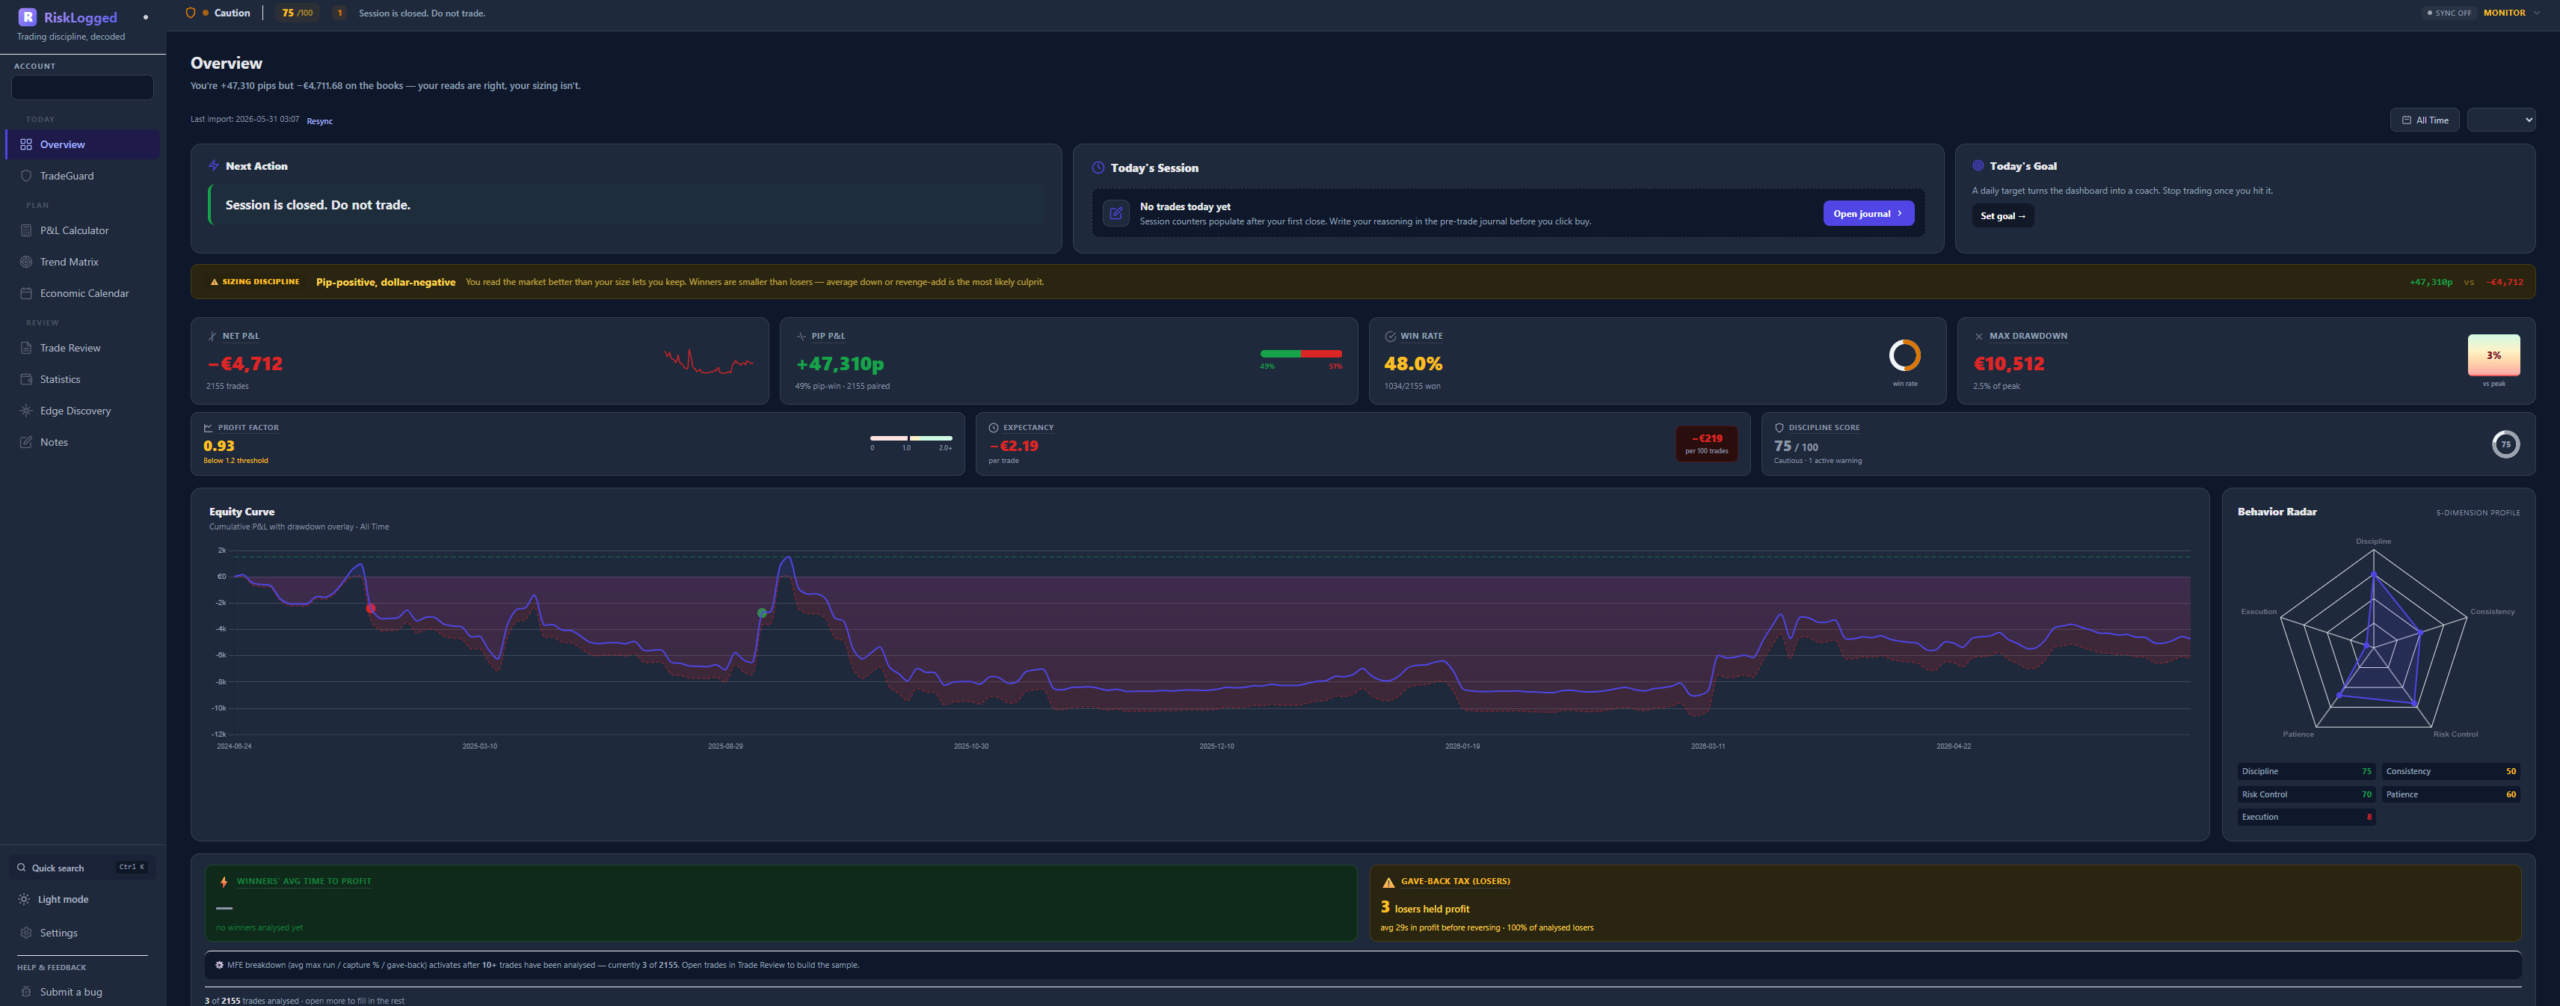
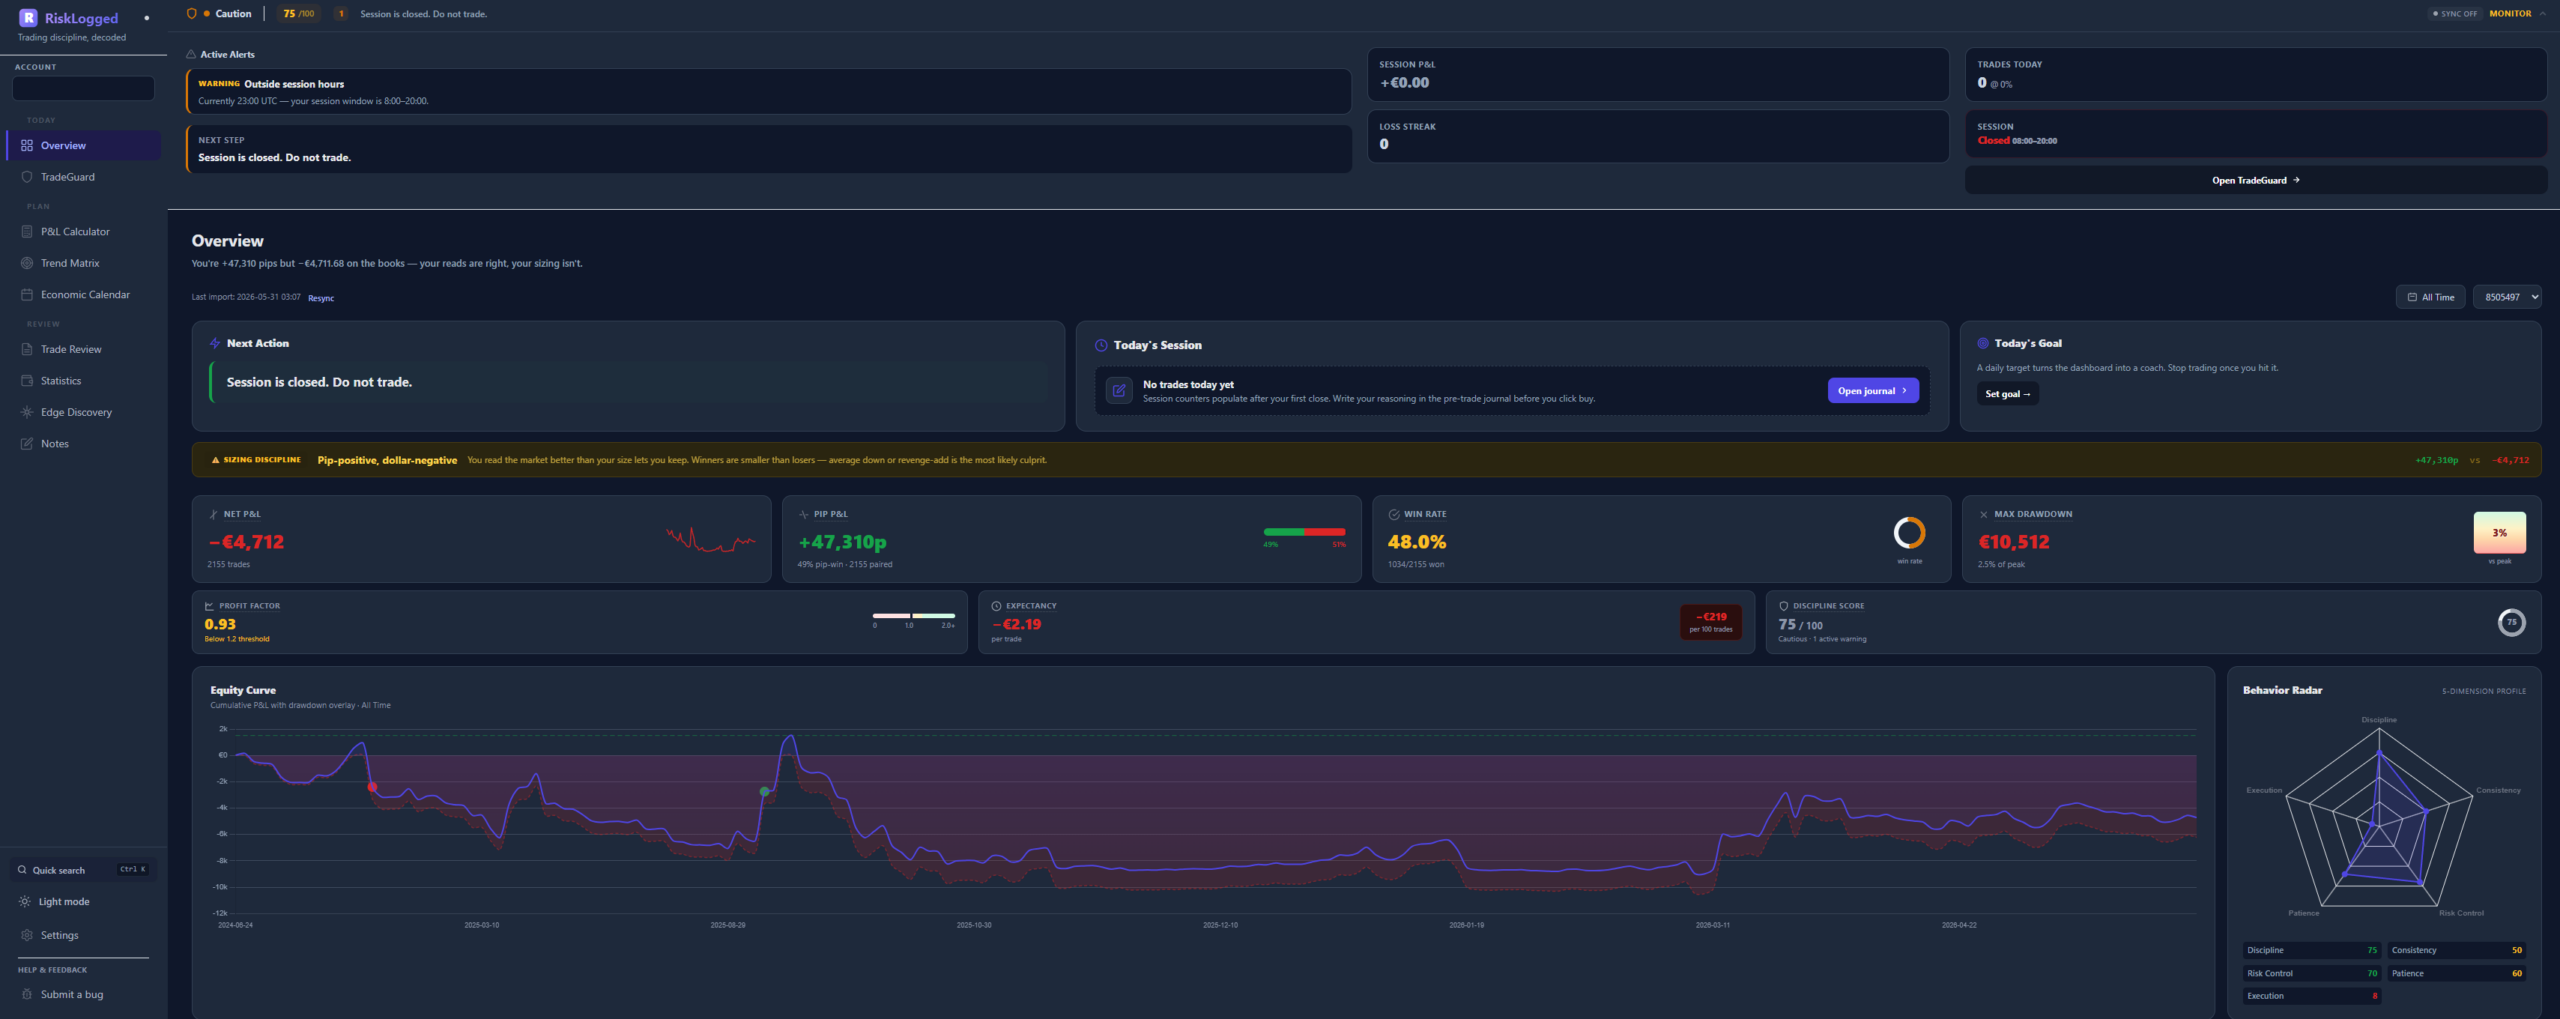
Overview
Today’s session, at a glance.
The first page you see. Live discipline state, account snapshot, equity curve, behavioral fingerprint — the only screen you need before market open.
 01020304
- 01
Live discipline state
TradeGuard ribbon across the top. “Stop trading for 15 minutes. 3 losses in a row.” — the journal stops you the moment behavior crosses the threshold you set when calm.
- 02
KPI tiles
Net P&L, pips, win rate, biggest open position — in your account’s native currency, recomputed live from your broker’s ledger.
- 03
Equity curve
60-day rolling equity with mean-revert markers and drawdown shading. Hover any point for that day’s trade list.
- 04
Behavior Radar
Five-axis read of how you’re trading right now — sizing, consistency, discipline, risk control, patience — vs. your healthy baseline.
TradeGuard
The forcing function for discipline.
A live behavioral guard, not a post-mortem. Watches the patterns that precede a blow-up — oversizing, fast re-entries after a loss, sessions outside your normal window — and shifts state in real time.
 01020304
- 01
Mode switch
OFF → MONITOR → STRICT. You set it once when calm. The journal enforces it when you’re not.
- 02
Active cooldown
“Stop trading for 15 minutes” with a live countdown. The button to log a new trade is disabled until the timer clears.
- 03
Daily counters
Max consecutive losses, current streak, current daily drawdown vs. cap — every number you actually care about, refreshed on every fill.
- 04
Behavior radar — 14d
The five-axis fingerprint of your sizing consistency, sleep gate, session window, hold-time discipline, and re-entry latency.
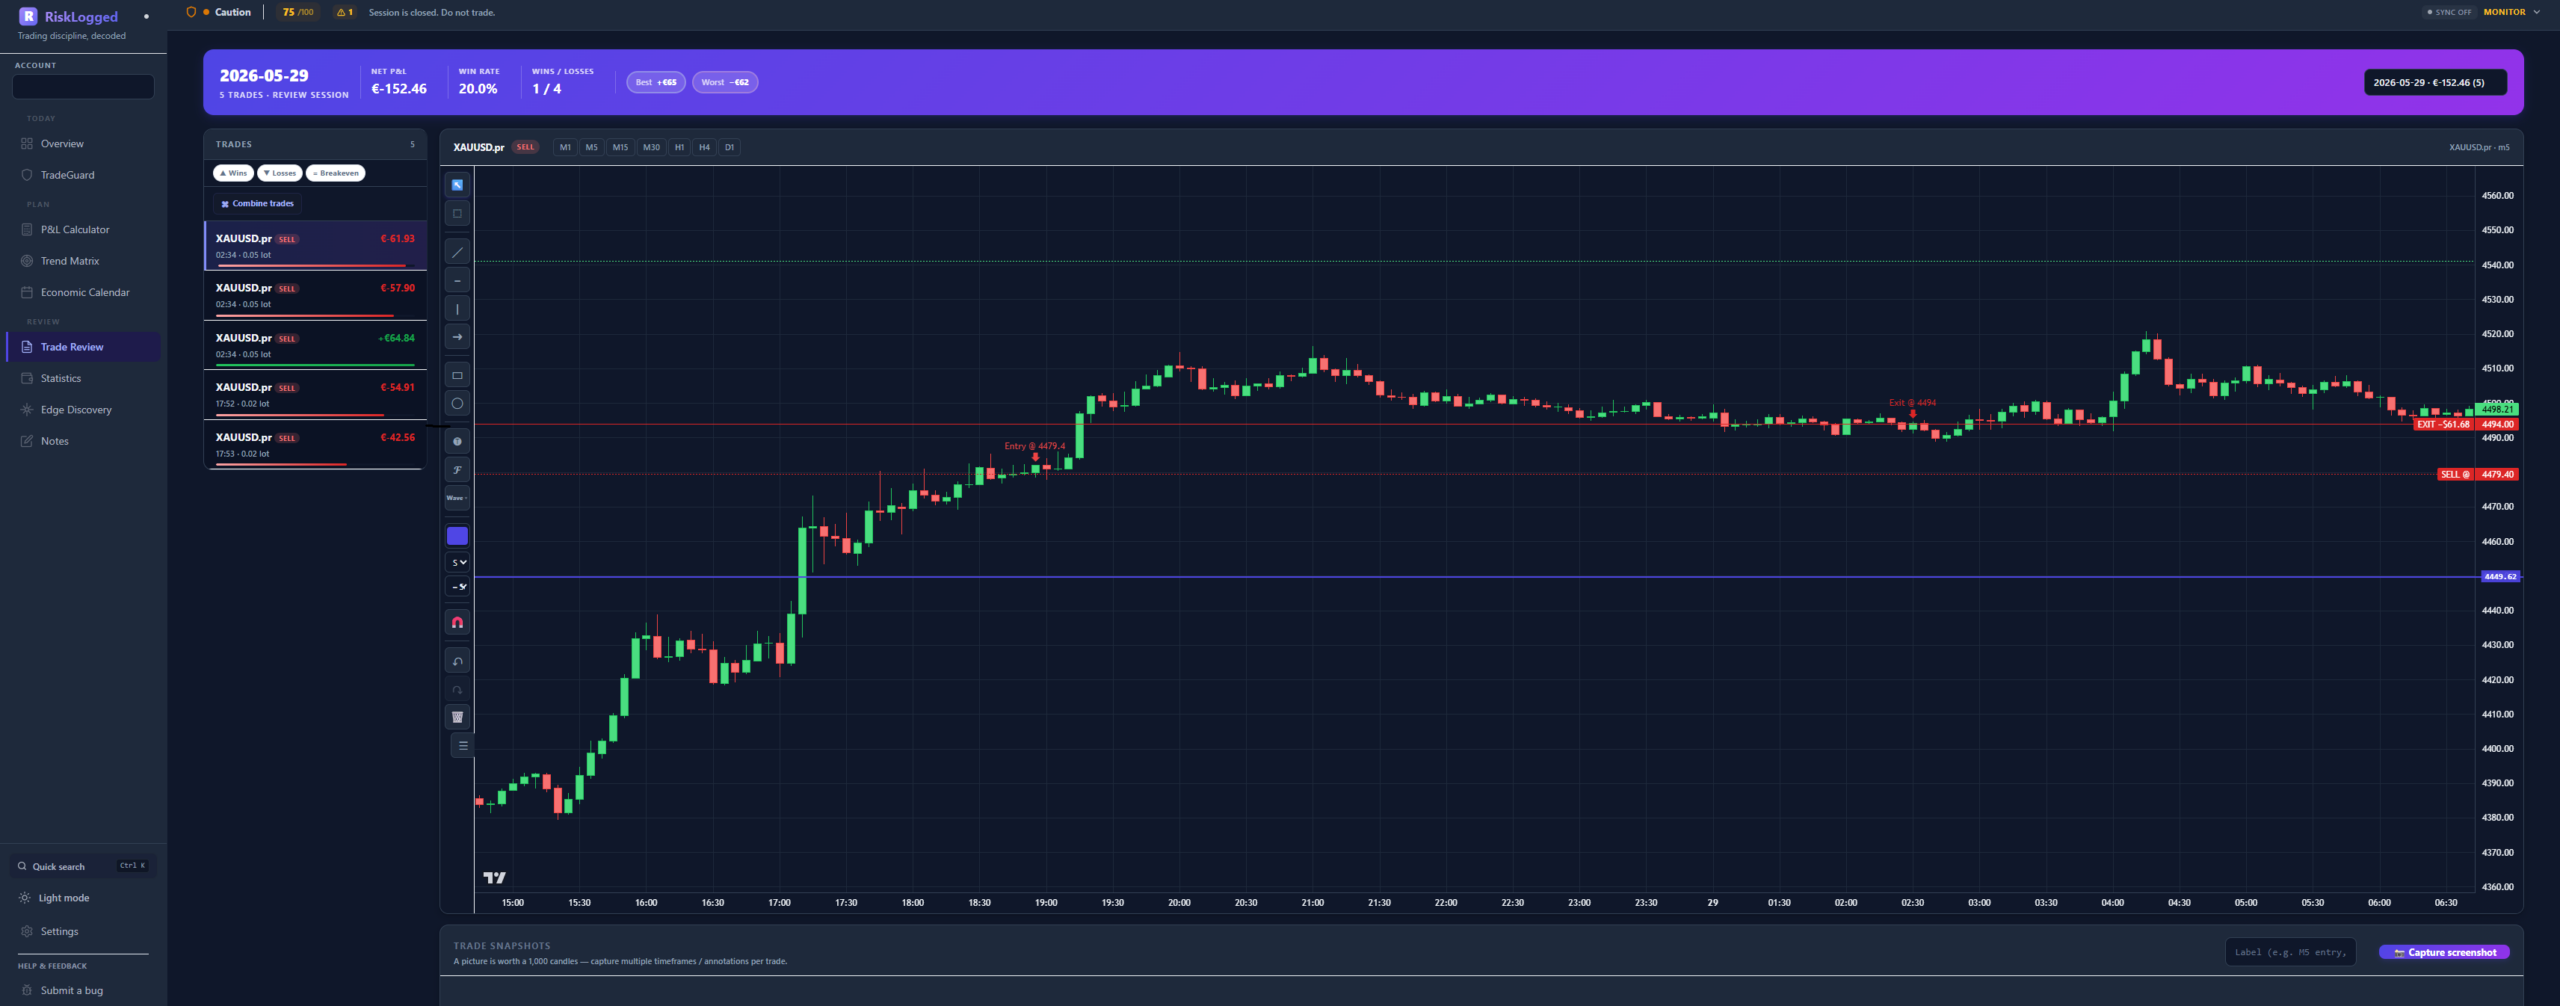
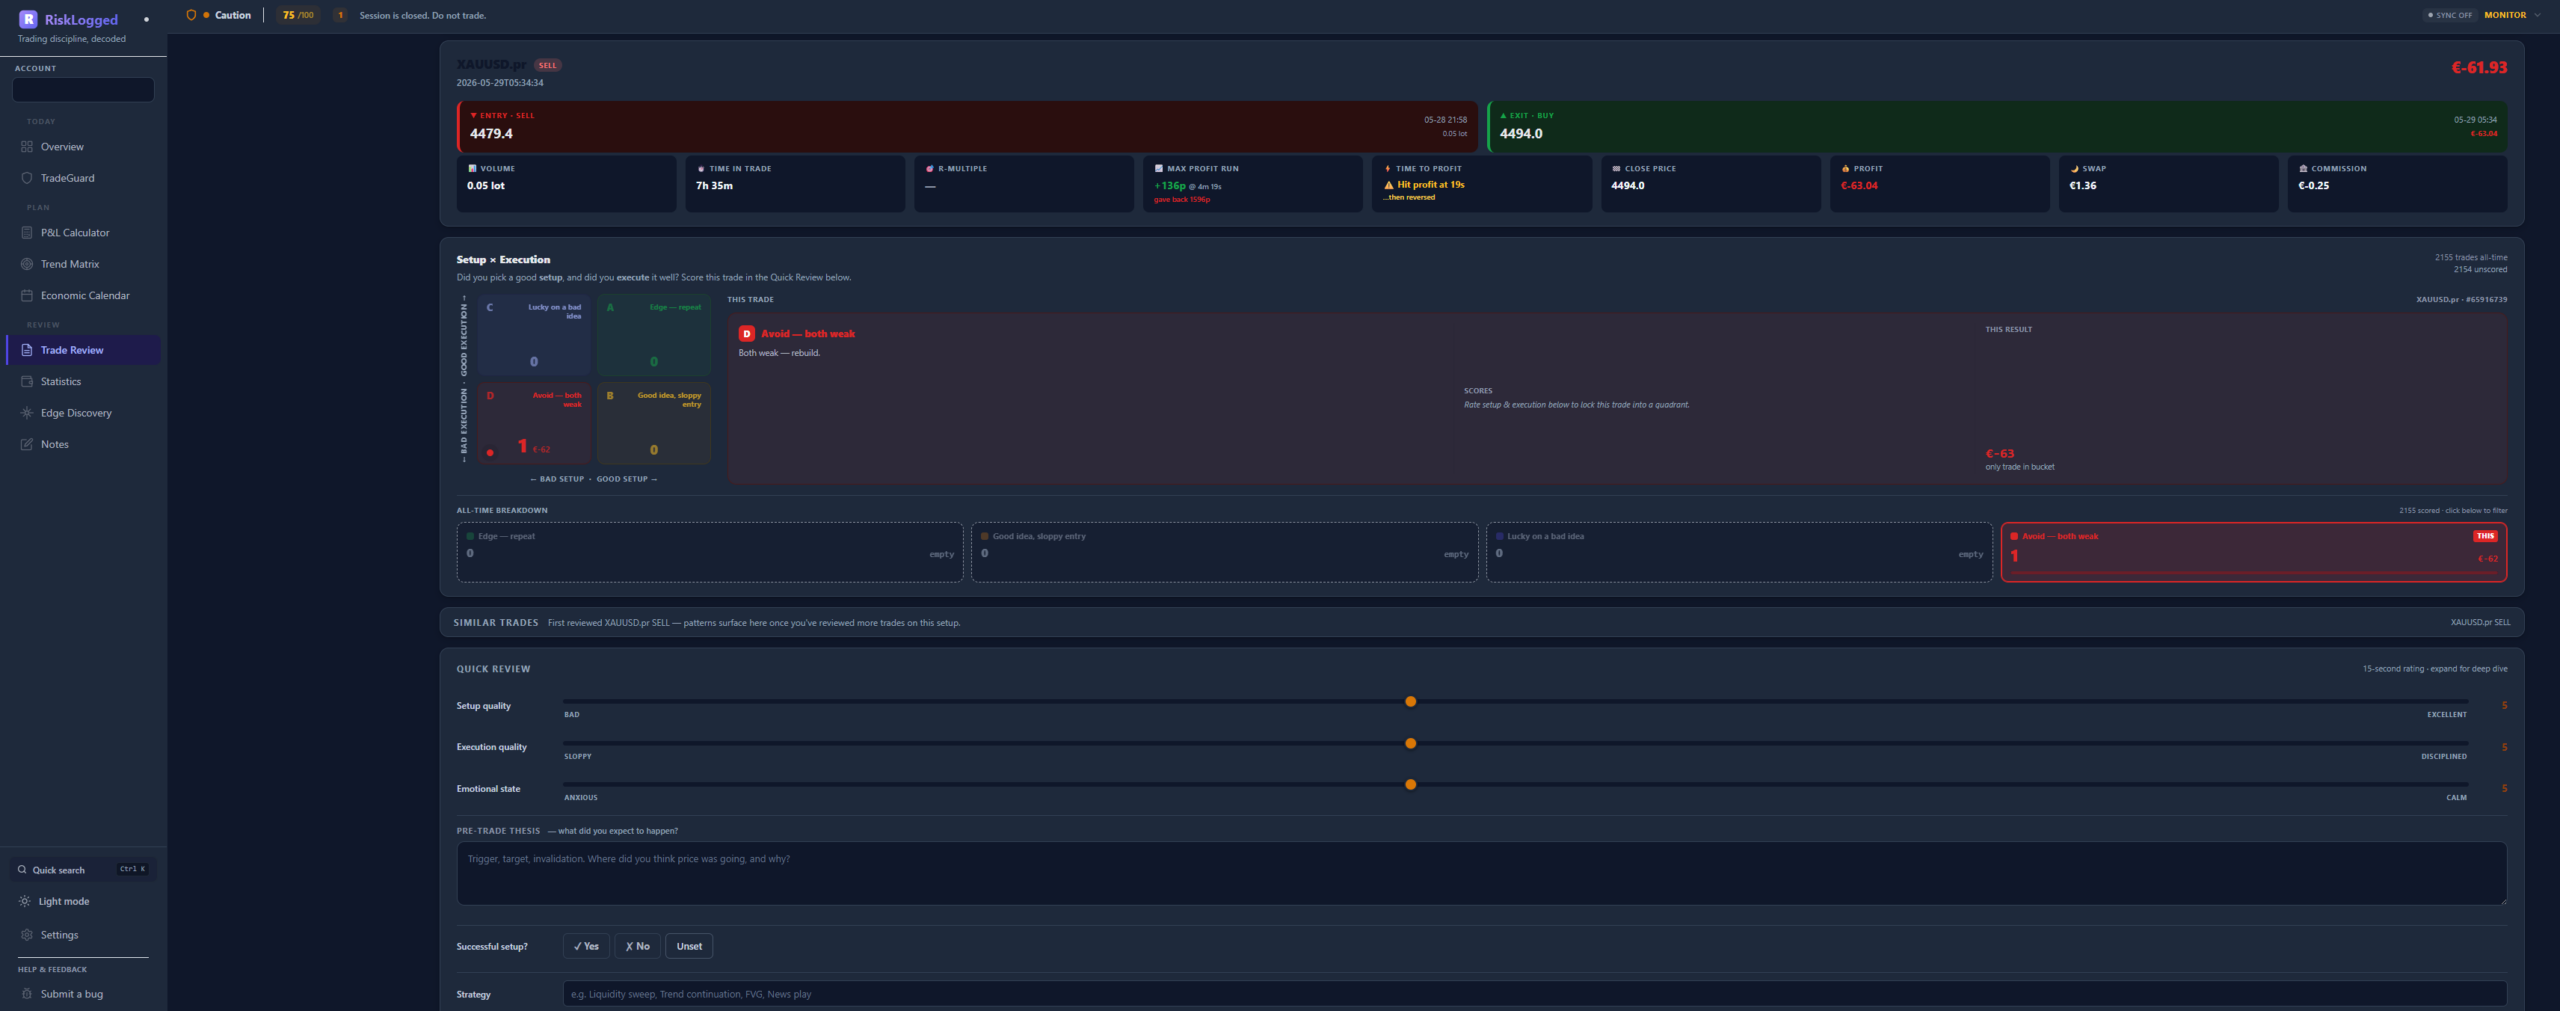
Trade Review
Every trade, marker by marker.
Entry, scale-ins, stop adjustments, partials, exit — all rebuilt on broker bars. Score the setup. Score the execution. Write down what you were actually thinking.
 01020304
- 01
Replayable chart
Real broker candles, not generic placeholders. Every fill marked with its real timestamp and price.
- 02
Annotation toolbar
Trendlines, fibs, rectangles, free text. Snap modes and color presets so you can mark up the chart without leaving the keyboard.
- 03
Trade detail strip
Date, direction, R-multiple, net P&L, commission, hold time — all on one row, all in your account currency.
- 04
Plan vs. behavior
Setup quality, execution quality, plan adherence, emotional state at entry. Plan vs. behavior, side by side.
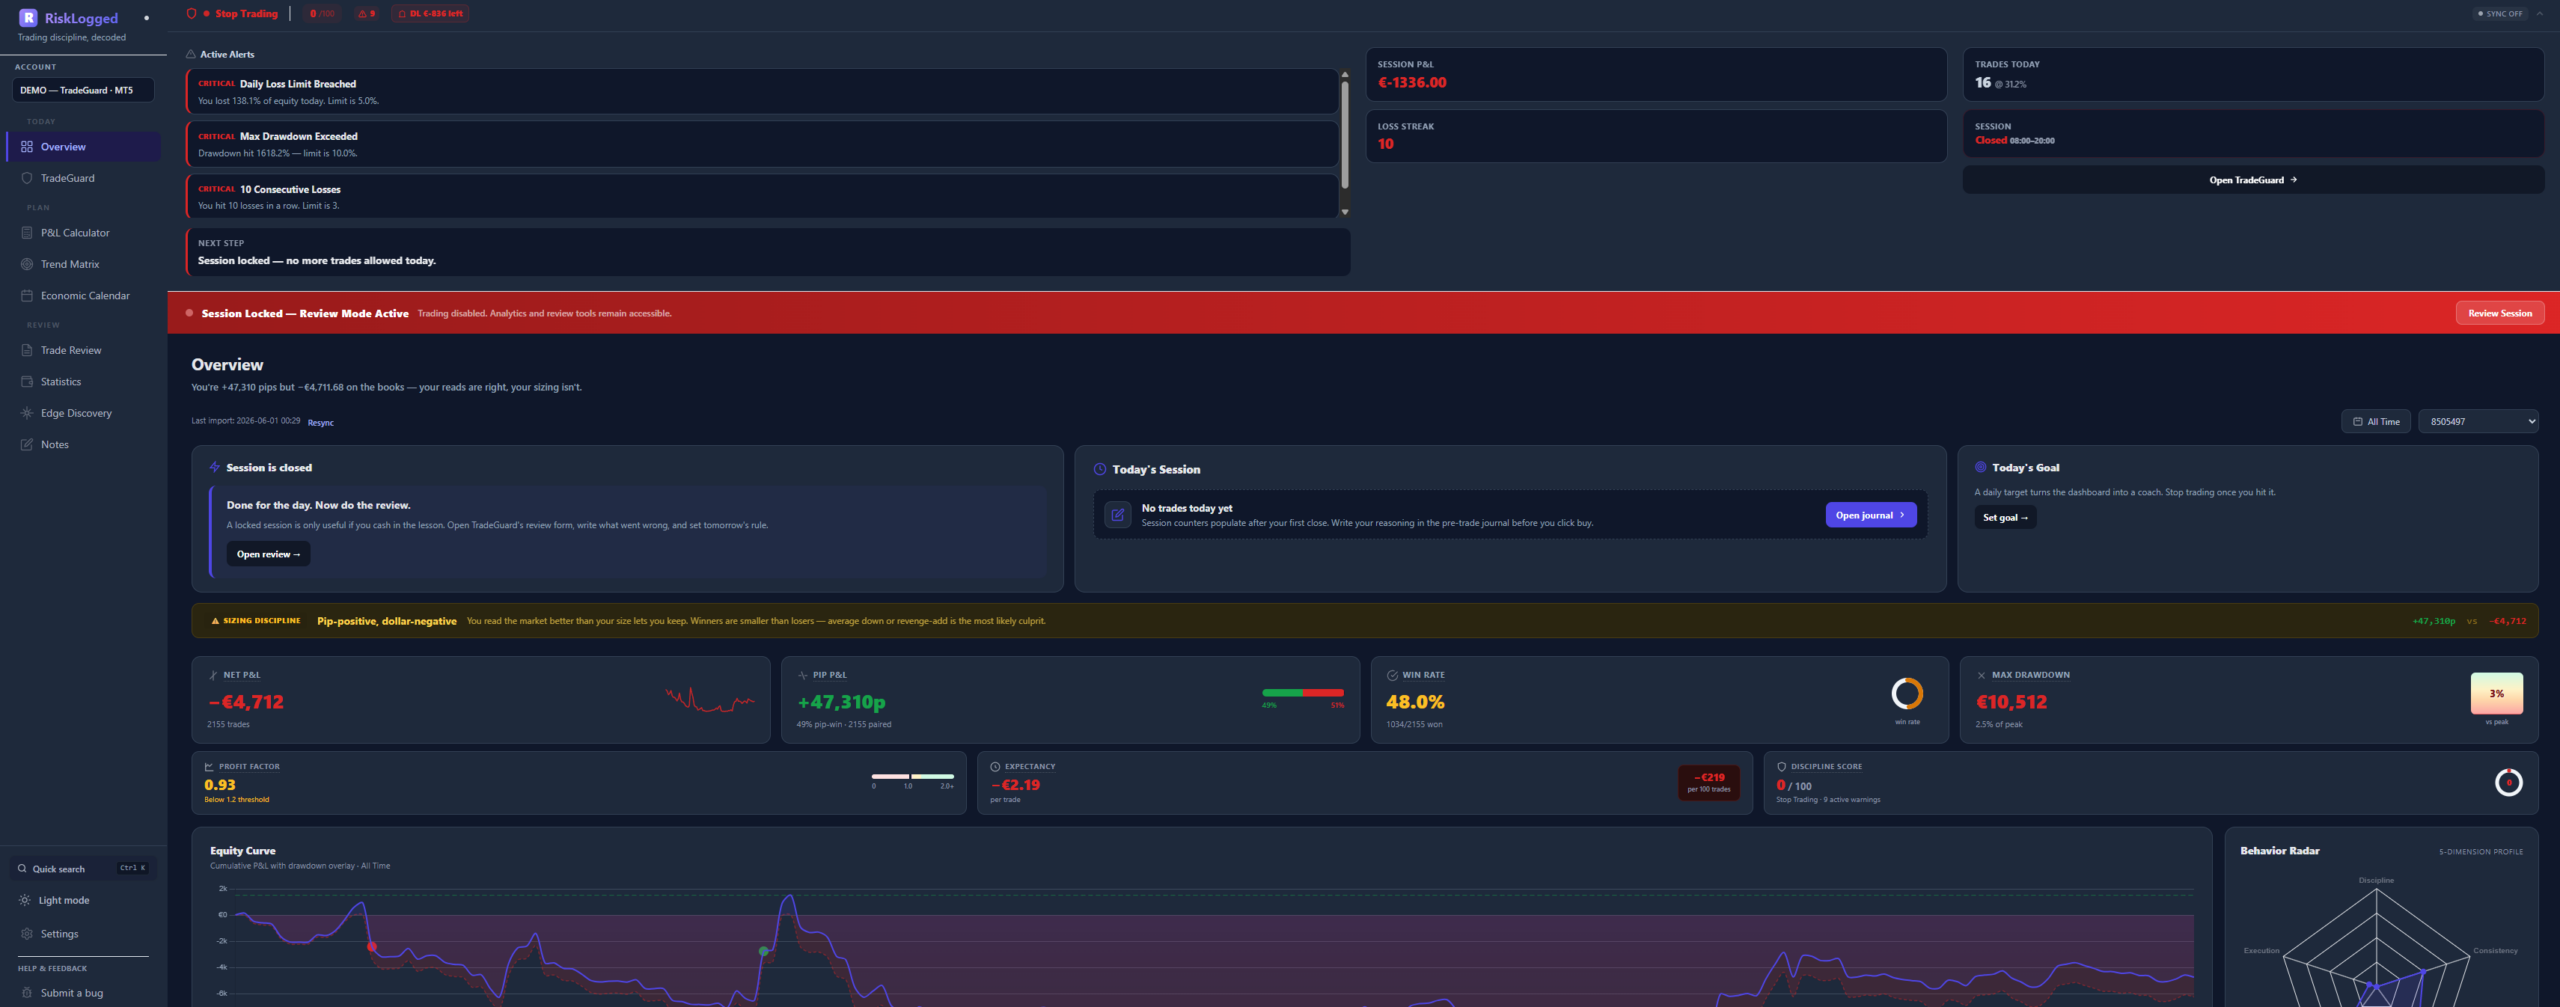
TradeGuard · live alerts
The alert that lands before the loss.
Cross a limit you set when calm — daily loss, max drawdown, a losing streak — and TradeGuard fires a live alert across the top of the app the moment it happens. Not in next week’s review.
- 01Daily loss limitThe moment the day’s loss crosses your cap, a critical banner appears across the top bar.
- 02Max drawdownAn equity-drawdown breach is flagged in red, with the exact figure that tripped it.
- 03Always in viewAlerts ride the top of every screen, so the warning is in front of you wherever you are.
- 04Set once, enforced alwaysYou define the limits when calm; TradeGuard holds the line when you’re not.
MOST JOURNALS TELL YOU WHAT YOU DID.
RiskLogged tells you while there’s still time to walk away.
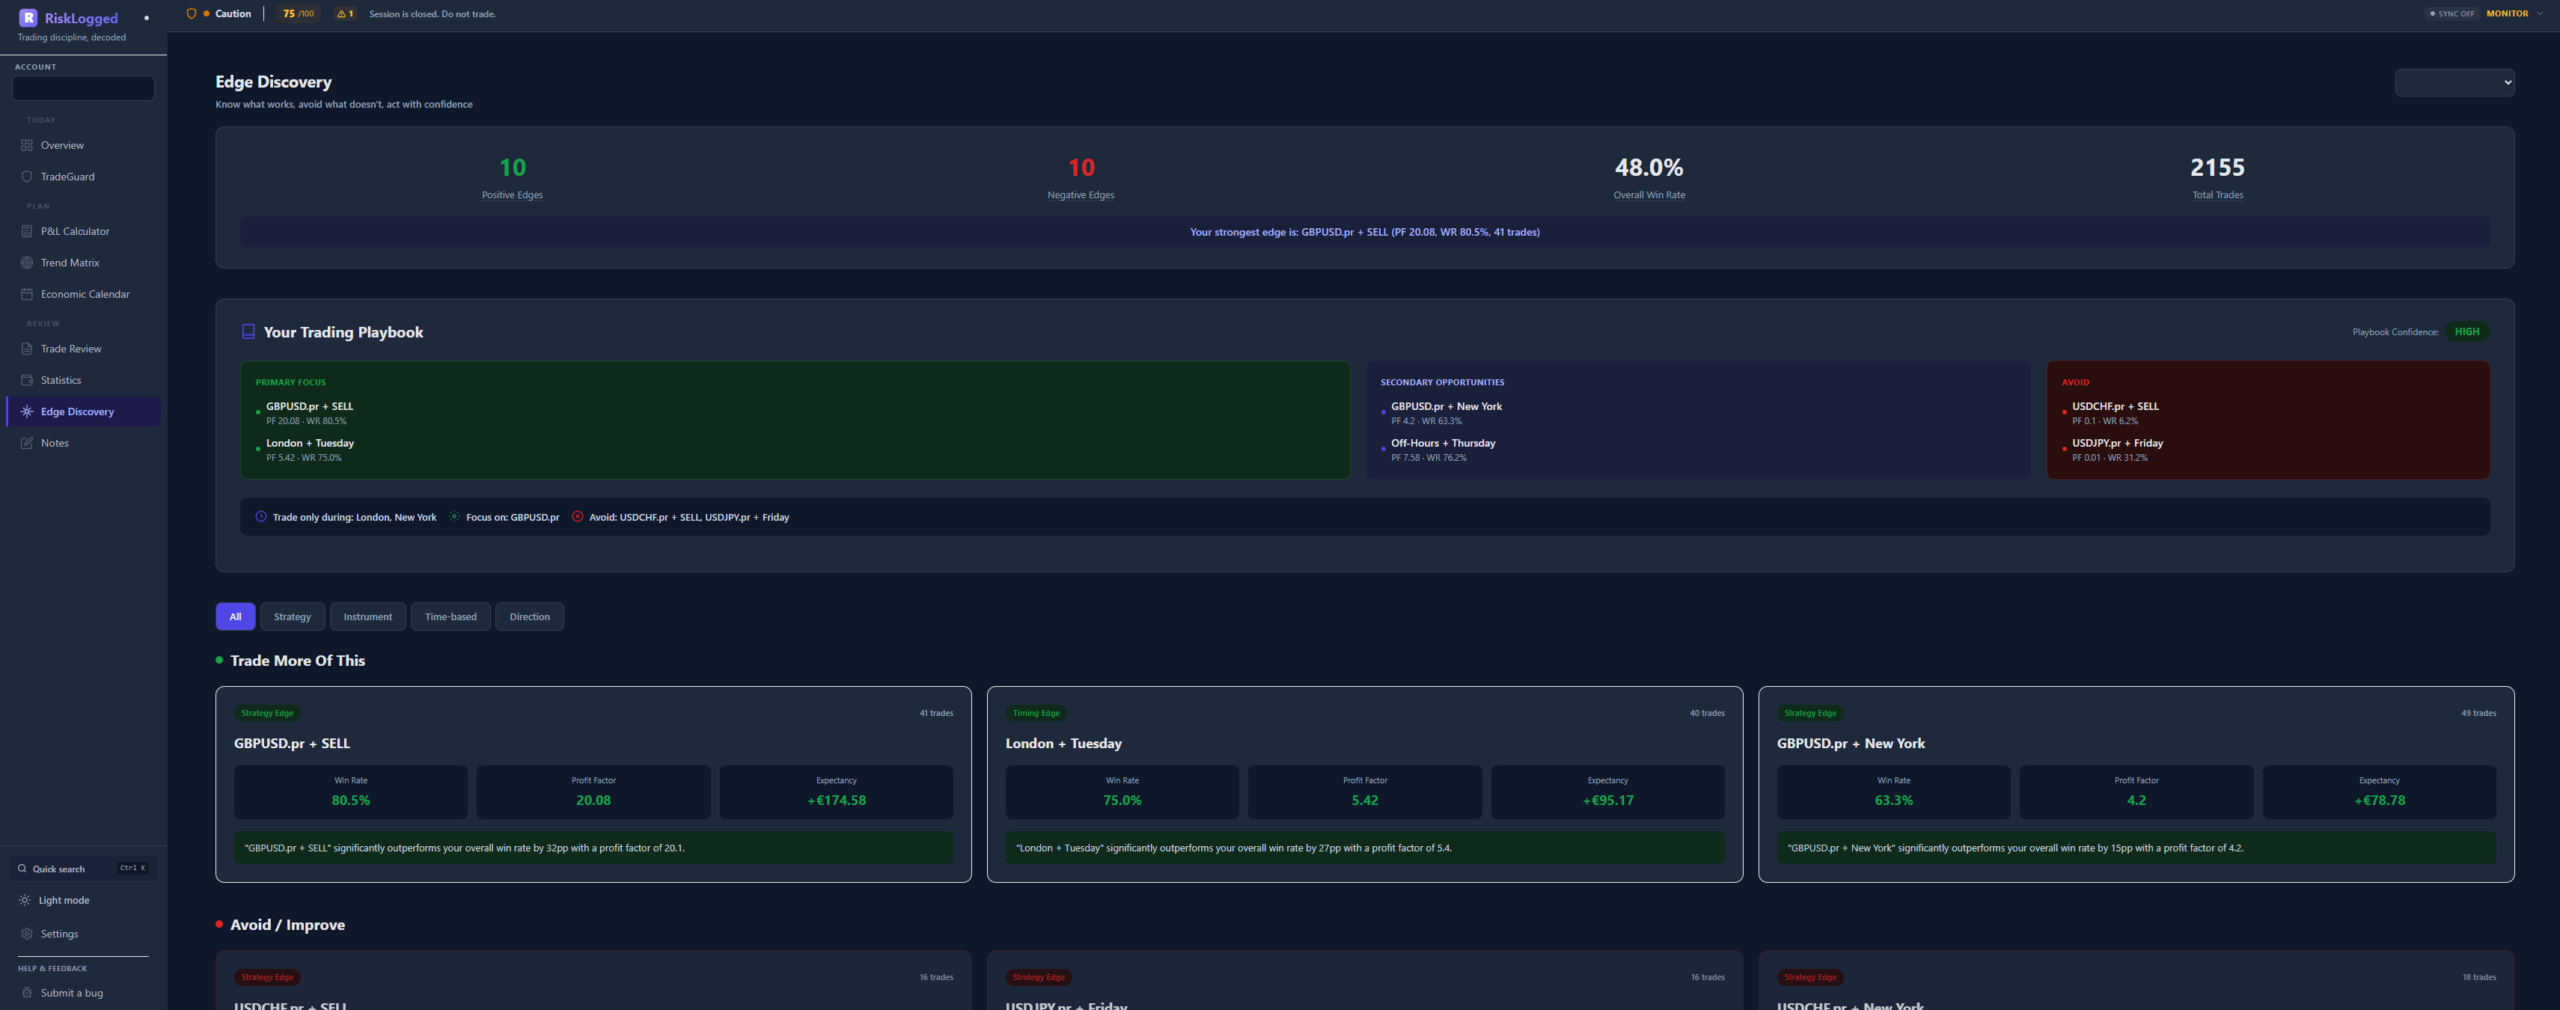
Edge Discovery
Find what’s actually paying you. Kill the rest.
Most traders have two setups that pay them and a long tail that bleeds them. Edge Discovery slices your history every way that matters and tells you which slices are positive expectancy.
 01020304
- 01
Top KPIs
Total trades, total edges discovered, profit factor across the book, current expectancy per trade.
- 02
Green playbook
Setup × session combinations with positive expectancy. The slices you should be taking more of.
- 03
Negative-expectancy panels
The slices that consistently lose. Sorted by drag on your account so the worst offender is first.
- 04
Slice by anything
Setup, session, instrument, day of week, hold time, R-bucket. Filter pills above the table.
Statistics
Numbers that match your broker.
Profit factor that handles infinite cases. R-multiple from real stop distance. Performance by day that skips Saturday. Sign-aware. Currency-consistent. Every number is the number.
 01020304
- 01
KPI strip
Profit factor, expectancy, average win/loss, payoff ratio — all in your account currency, all sign-aware.
- 02
Distribution charts
P&L histogram, R-bucket distribution, win/loss split. Spot whether your edge comes from frequency or magnitude.
- 03
Performance by day
Skips Saturday. Streak smoothness instead of just streak count. Sizing consistency flags the day you double-sized.
- 04
Session overlap notes
Every session metric annotated when overlapping sessions could double-count — honest math, not theatre.
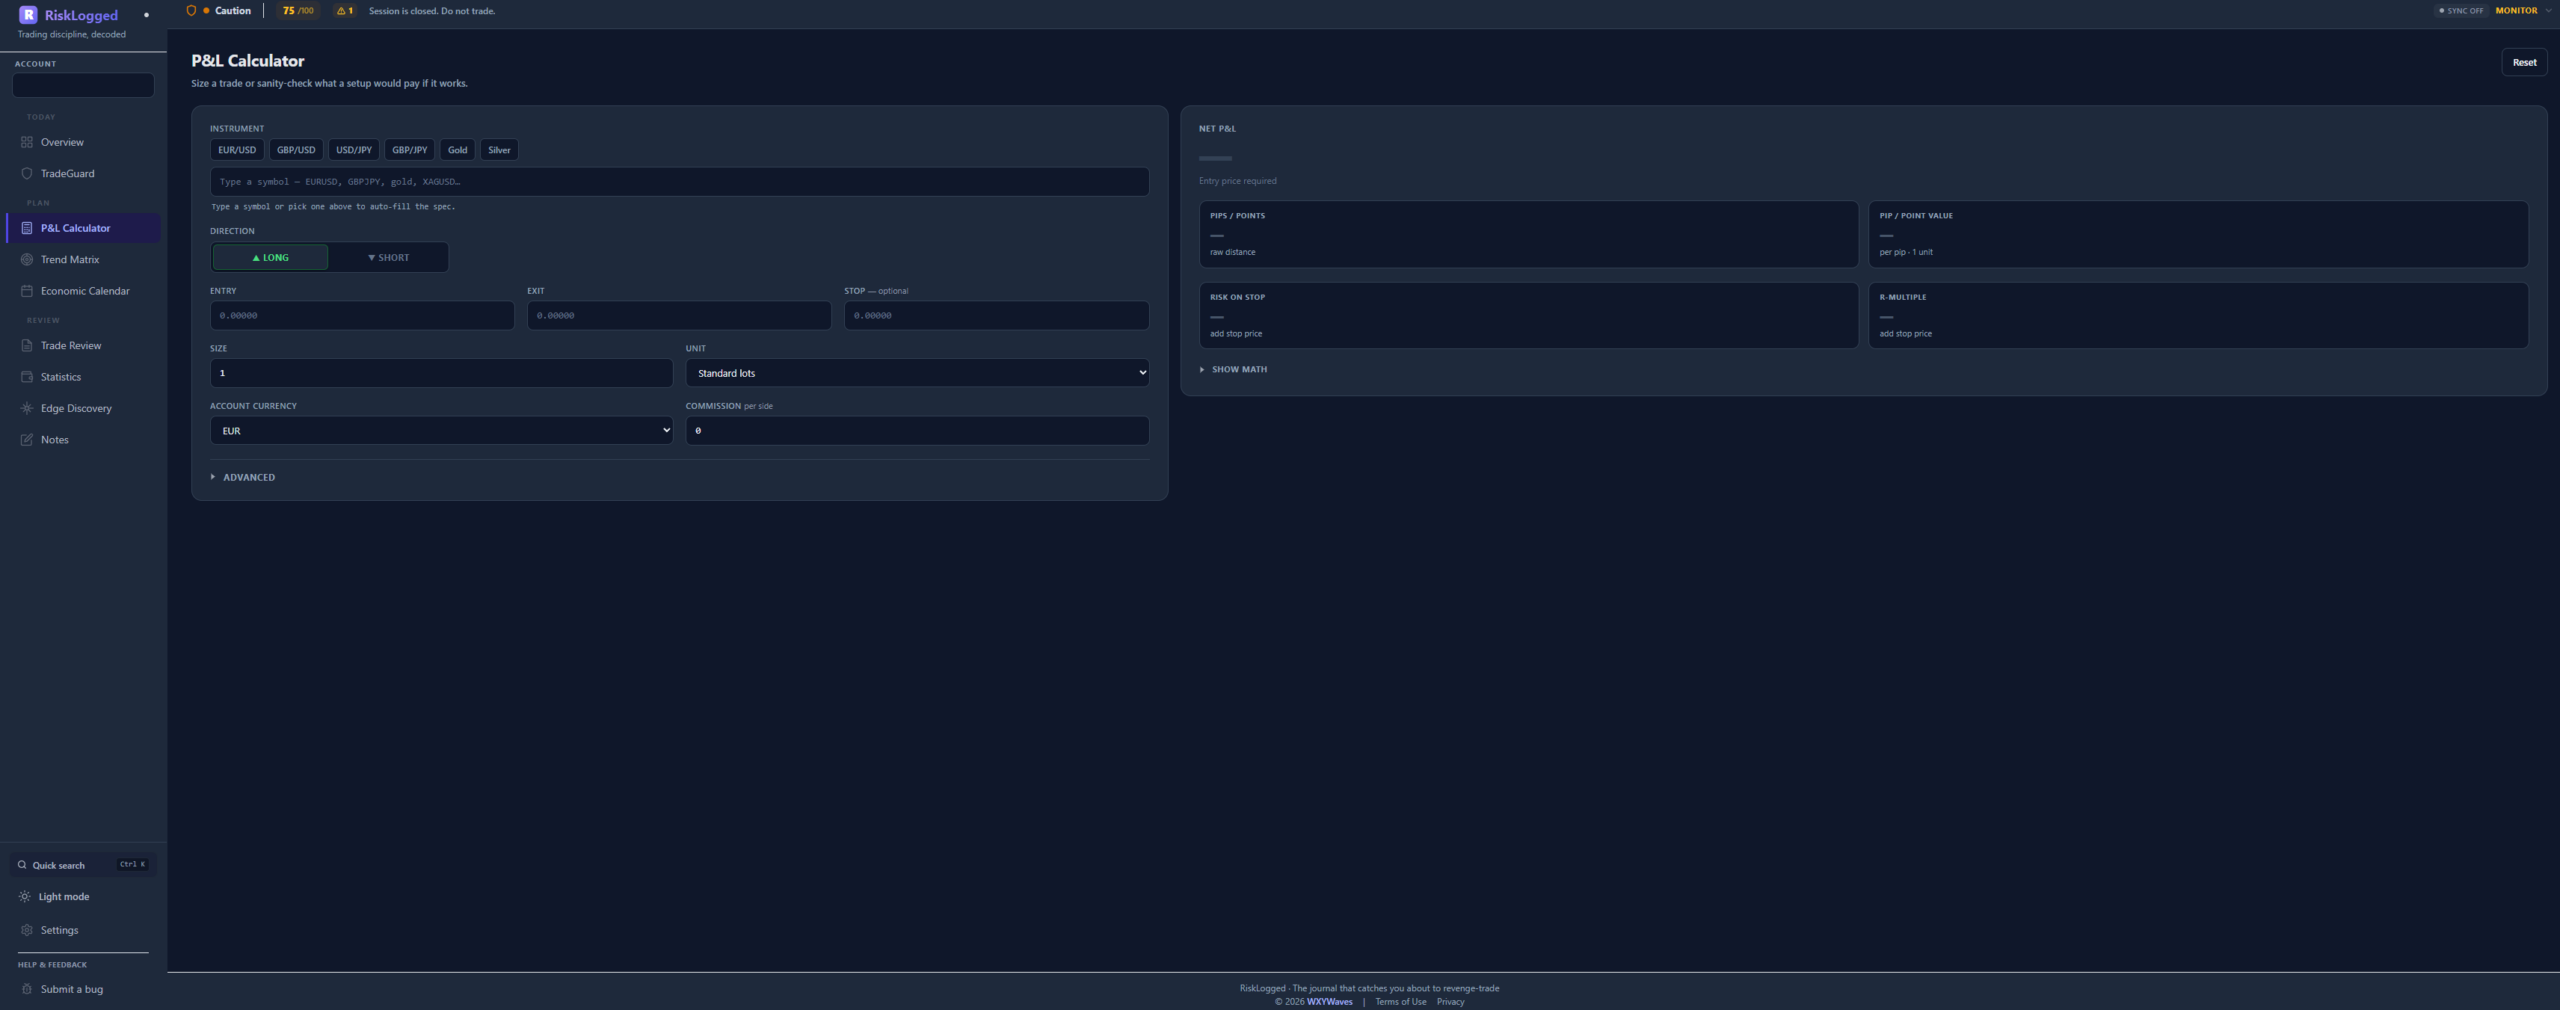
P&L Calculator
Sanity-check before the click.
Pulled out of the journal so you can use it without committing. Forex, gold, silver presets. Auto-reads your active account currency. Pip value, risk on stop, R-multiple — instantly.
 01020304
- 01
Instrument presets
Forex majors, gold, silver — each preset carries the right contract size, pip size, and currency conversion logic.
- 02
Long / Short toggle
Sign-aware: a short setup outputs negative P&L for a price rise, correctly. No mental gymnastics required.
- 03
Entry / Exit / Stop / Size
All numeric inputs. Tab through them. Hit Enter. Done.
- 04
Live outputs
Pip value, risk on stop, R-multiple, net P&L after commission — in your account currency.
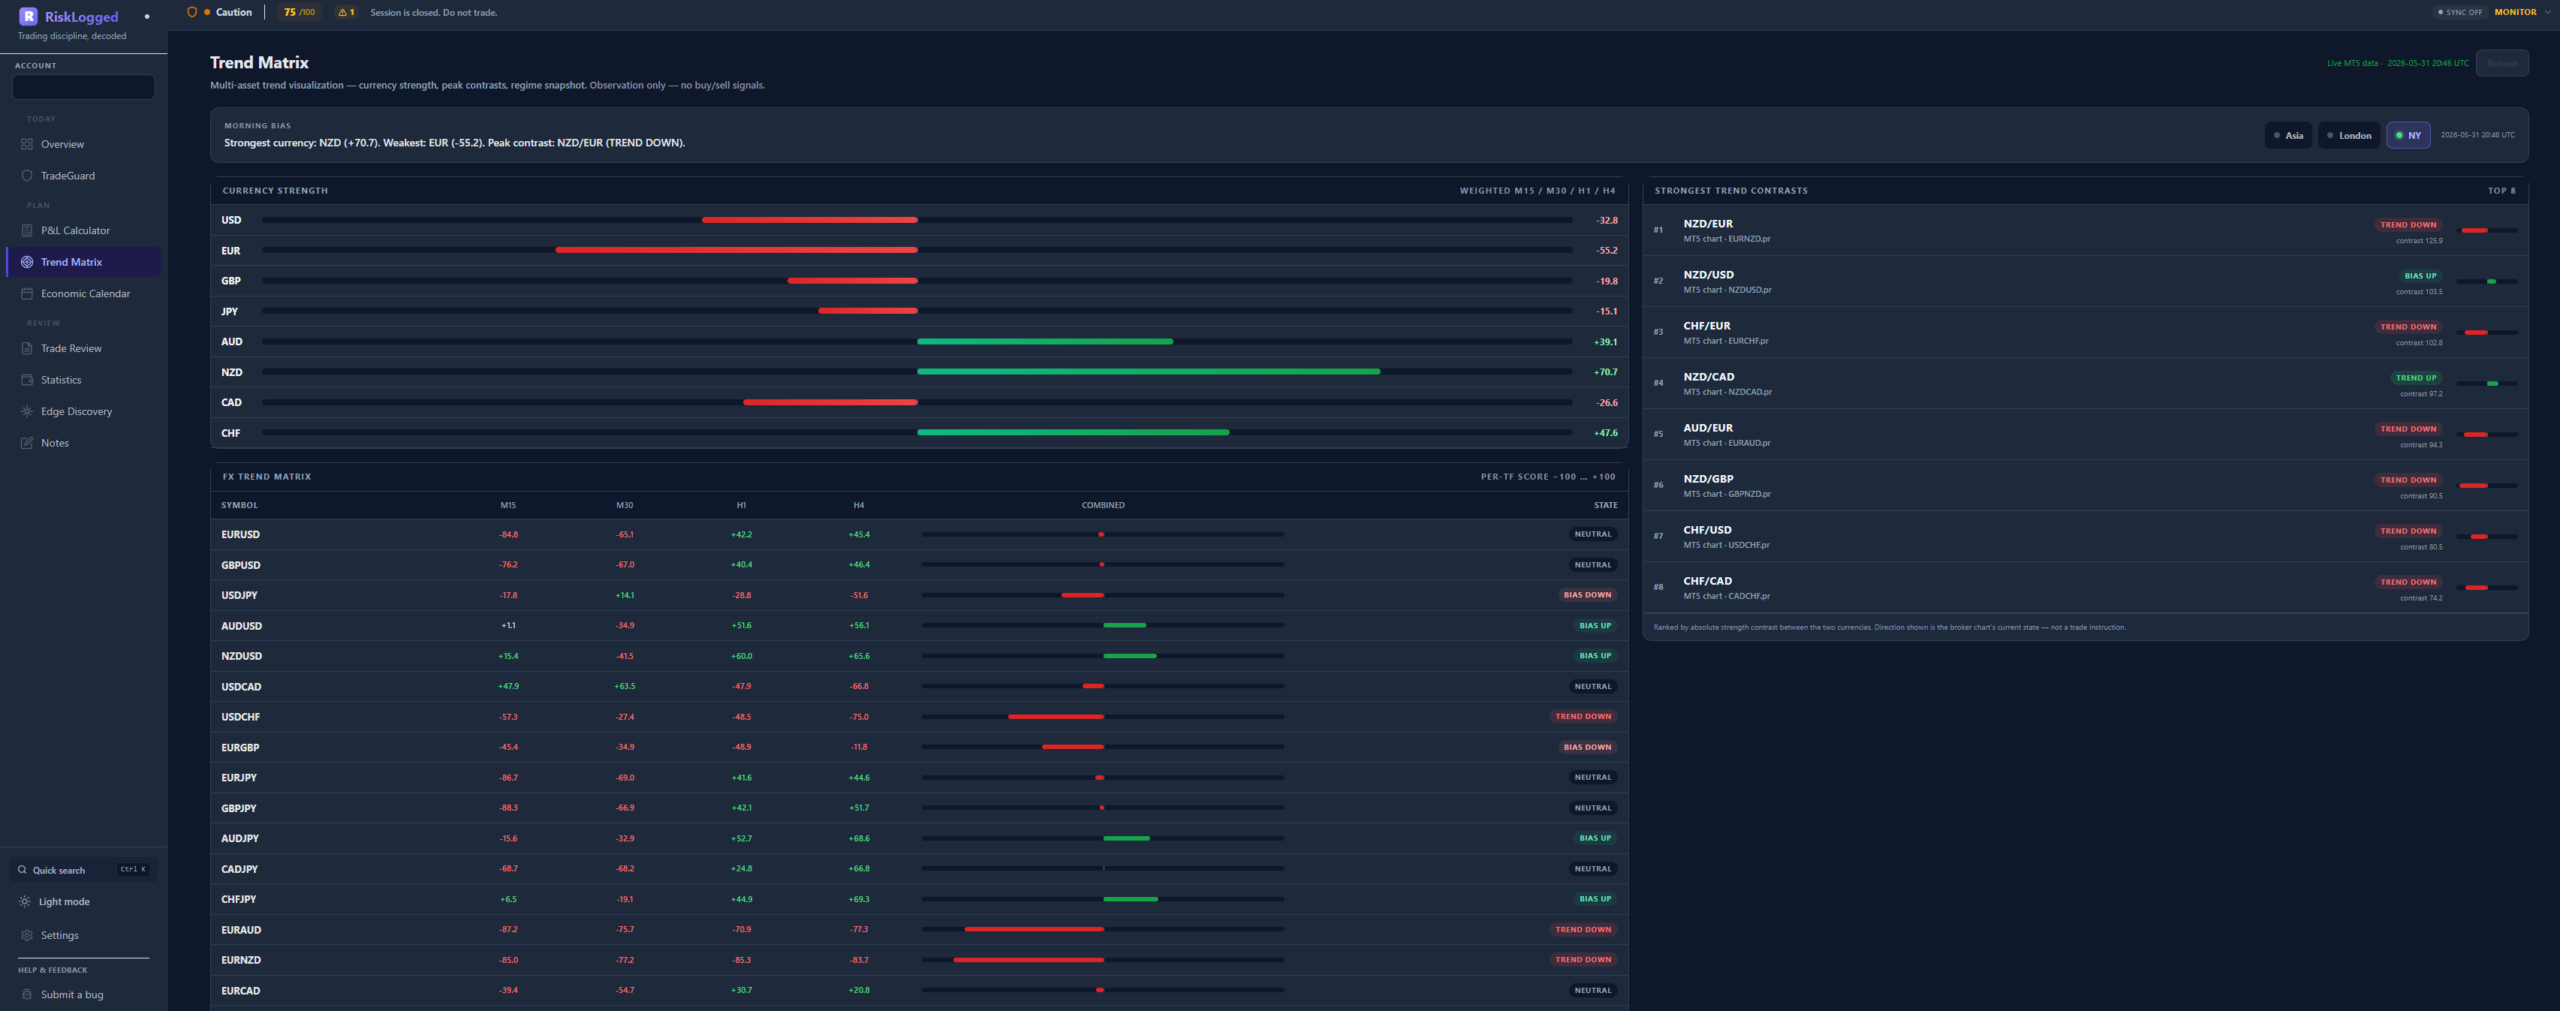
Trend Matrix
Higher-timeframe context, on one screen.
Multi-timeframe trend snapshot across your watchlist. See whether the higher-timeframe context agrees with the setup you’re about to take, before the click.
 01020304
- 01
Watchlist rows
Your tracked instruments, sorted by how much you actually trade them.
- 02
Timeframe columns
H1, H4, D, W — the four lenses that matter. Add more from settings if you trade lower or higher.
- 03
Color-coded cells
Green = trend up. Red = trend down. Intensity = strength. A glance tells you whether the matrix is in confluence.
- 04
Confluence read
Watch the diagonals. When H1 disagrees with W on the same row, that’s a setup waiting for one of them to flip.
EVERY NUMBER IS THE NUMBER.
Not a vibe. Not a heuristic. The real one, in your account currency.
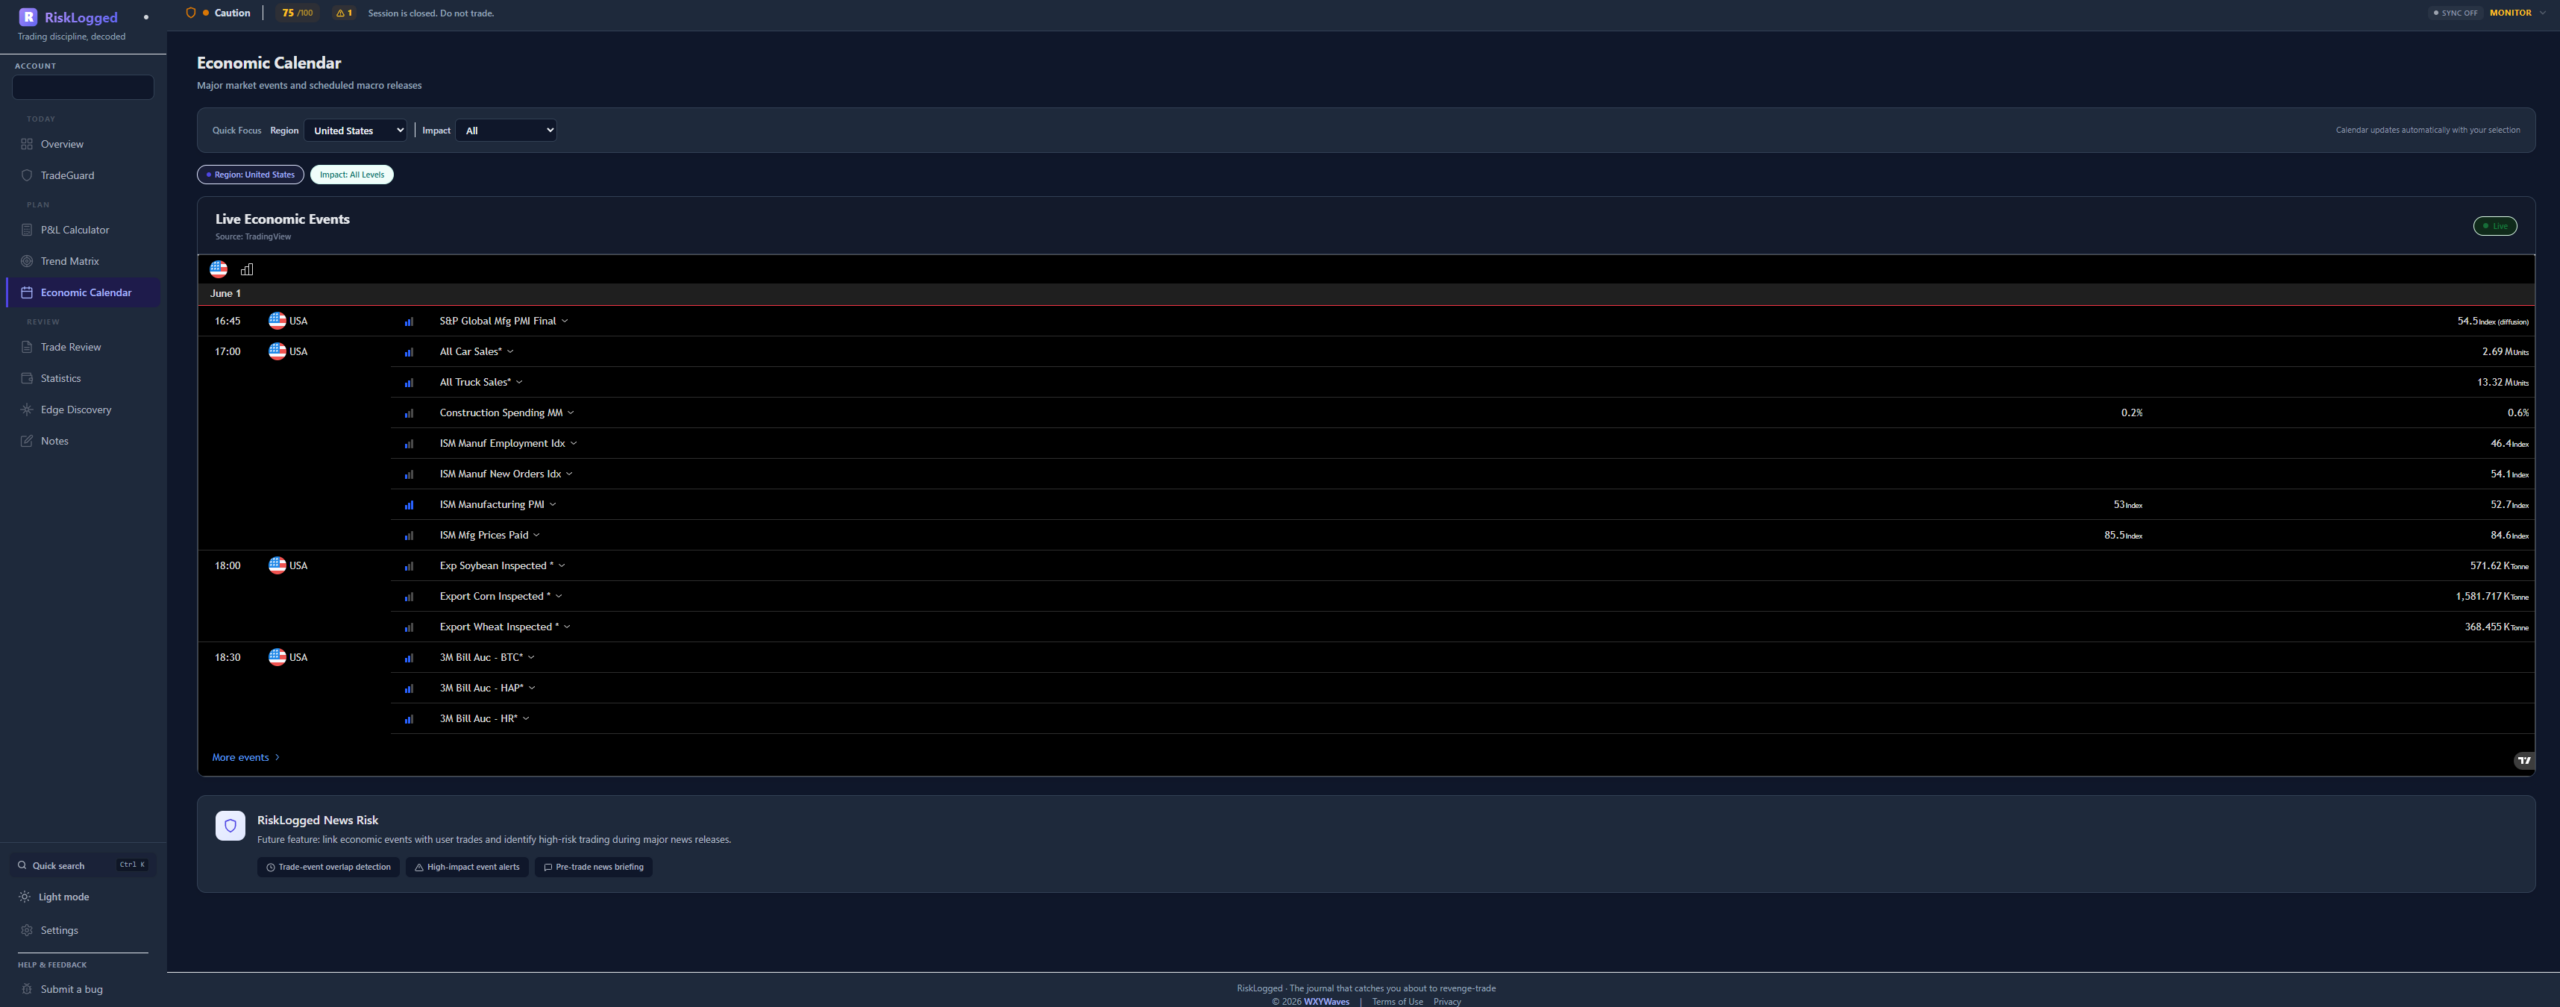
Economic Calendar
Macro context, themed to the app.
High-impact events, filtered by the currencies you actually trade, in your local time. No extra browser tab, no second window.
 01020304
- 01
Currency filter
Toggle the currencies you trade. The rest hide. Cuts the noise from a generic calendar to just your stack.
- 02
Impact indicators
Red dot = high impact. Yellow = medium. The journal flags any open trade that intersects a high-impact window.
- 03
Local time
Every timestamp converts to your machine’s local time — no DST math, no UTC offset mental load.
- 04
Inline
Lives inside the same window as your journal. One alt-tab to your chart and back, not two.
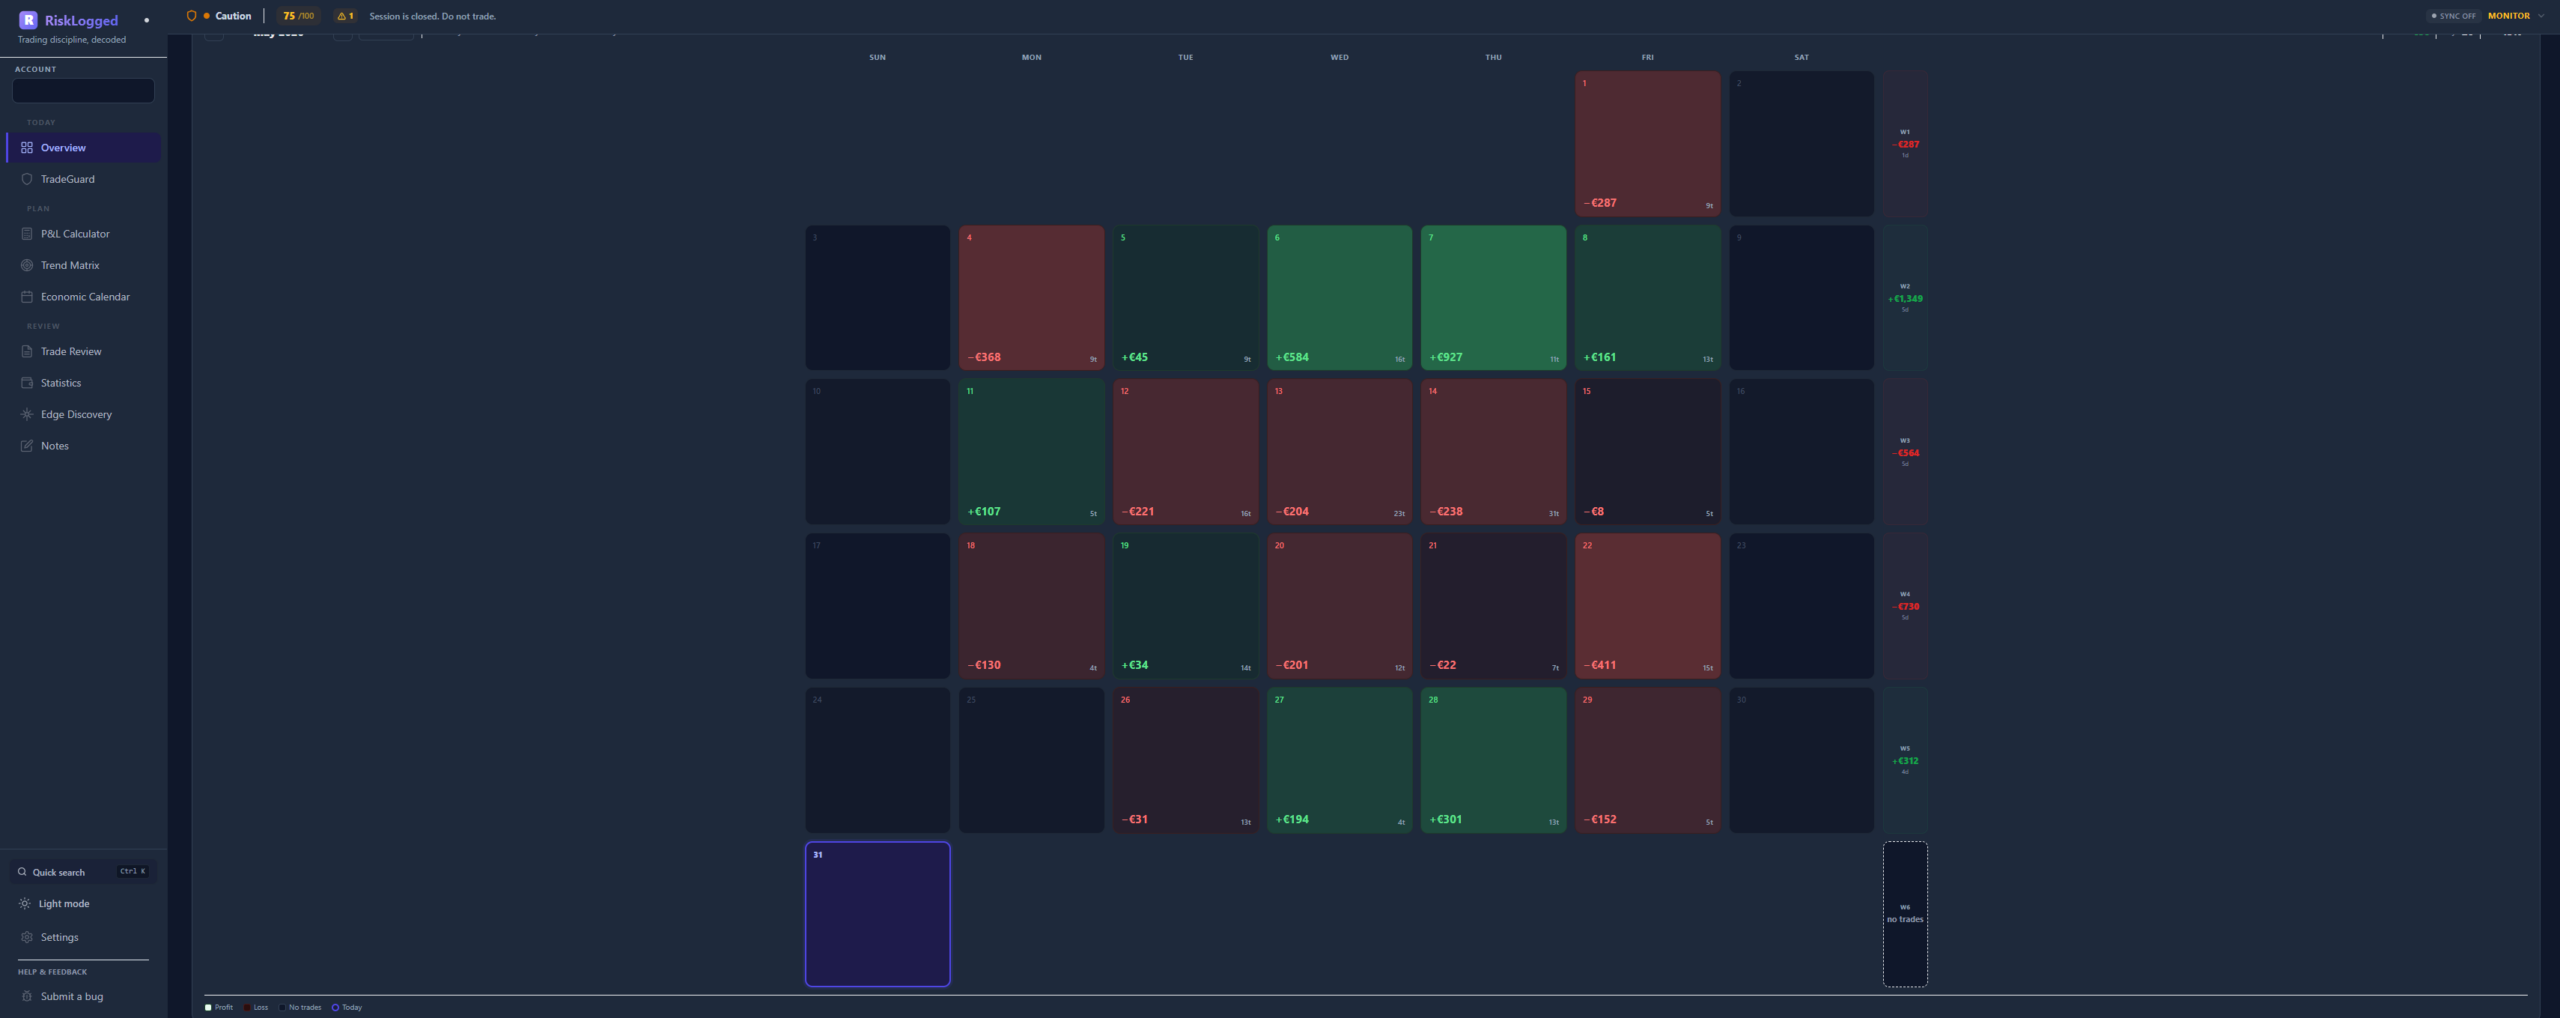
Performance Calendar
Every trading day, every month.
A month-by-month heatmap of every trading day. Spot the days that work. Catch the streaks that don’t. Hover any cell to drill into the day’s setup-by-setup breakdown.
 01020304
- 01
Heatmap intensity
Green/red shade encodes P&L magnitude, not just sign. A green-but-pale day is a win you almost gave back.
- 02
Per-cell totals
Each cell shows the day’s net P&L and trade count. Compare 5 days at a glance.
- 03
Month navigation
Step backward through your full account history. The journal never truncates.
- 04
Drill into a day
Click any cell to land on that day’s trade list. From there, jump straight into Trade Review for any individual fill.
TradeGuard · the hard stop
When it’s serious, it stops you.
Cross the line that matters most and TradeGuard doesn’t just warn — it takes over the screen with a full stop-trading intervention, forcing you to slow down before you can place another trade.
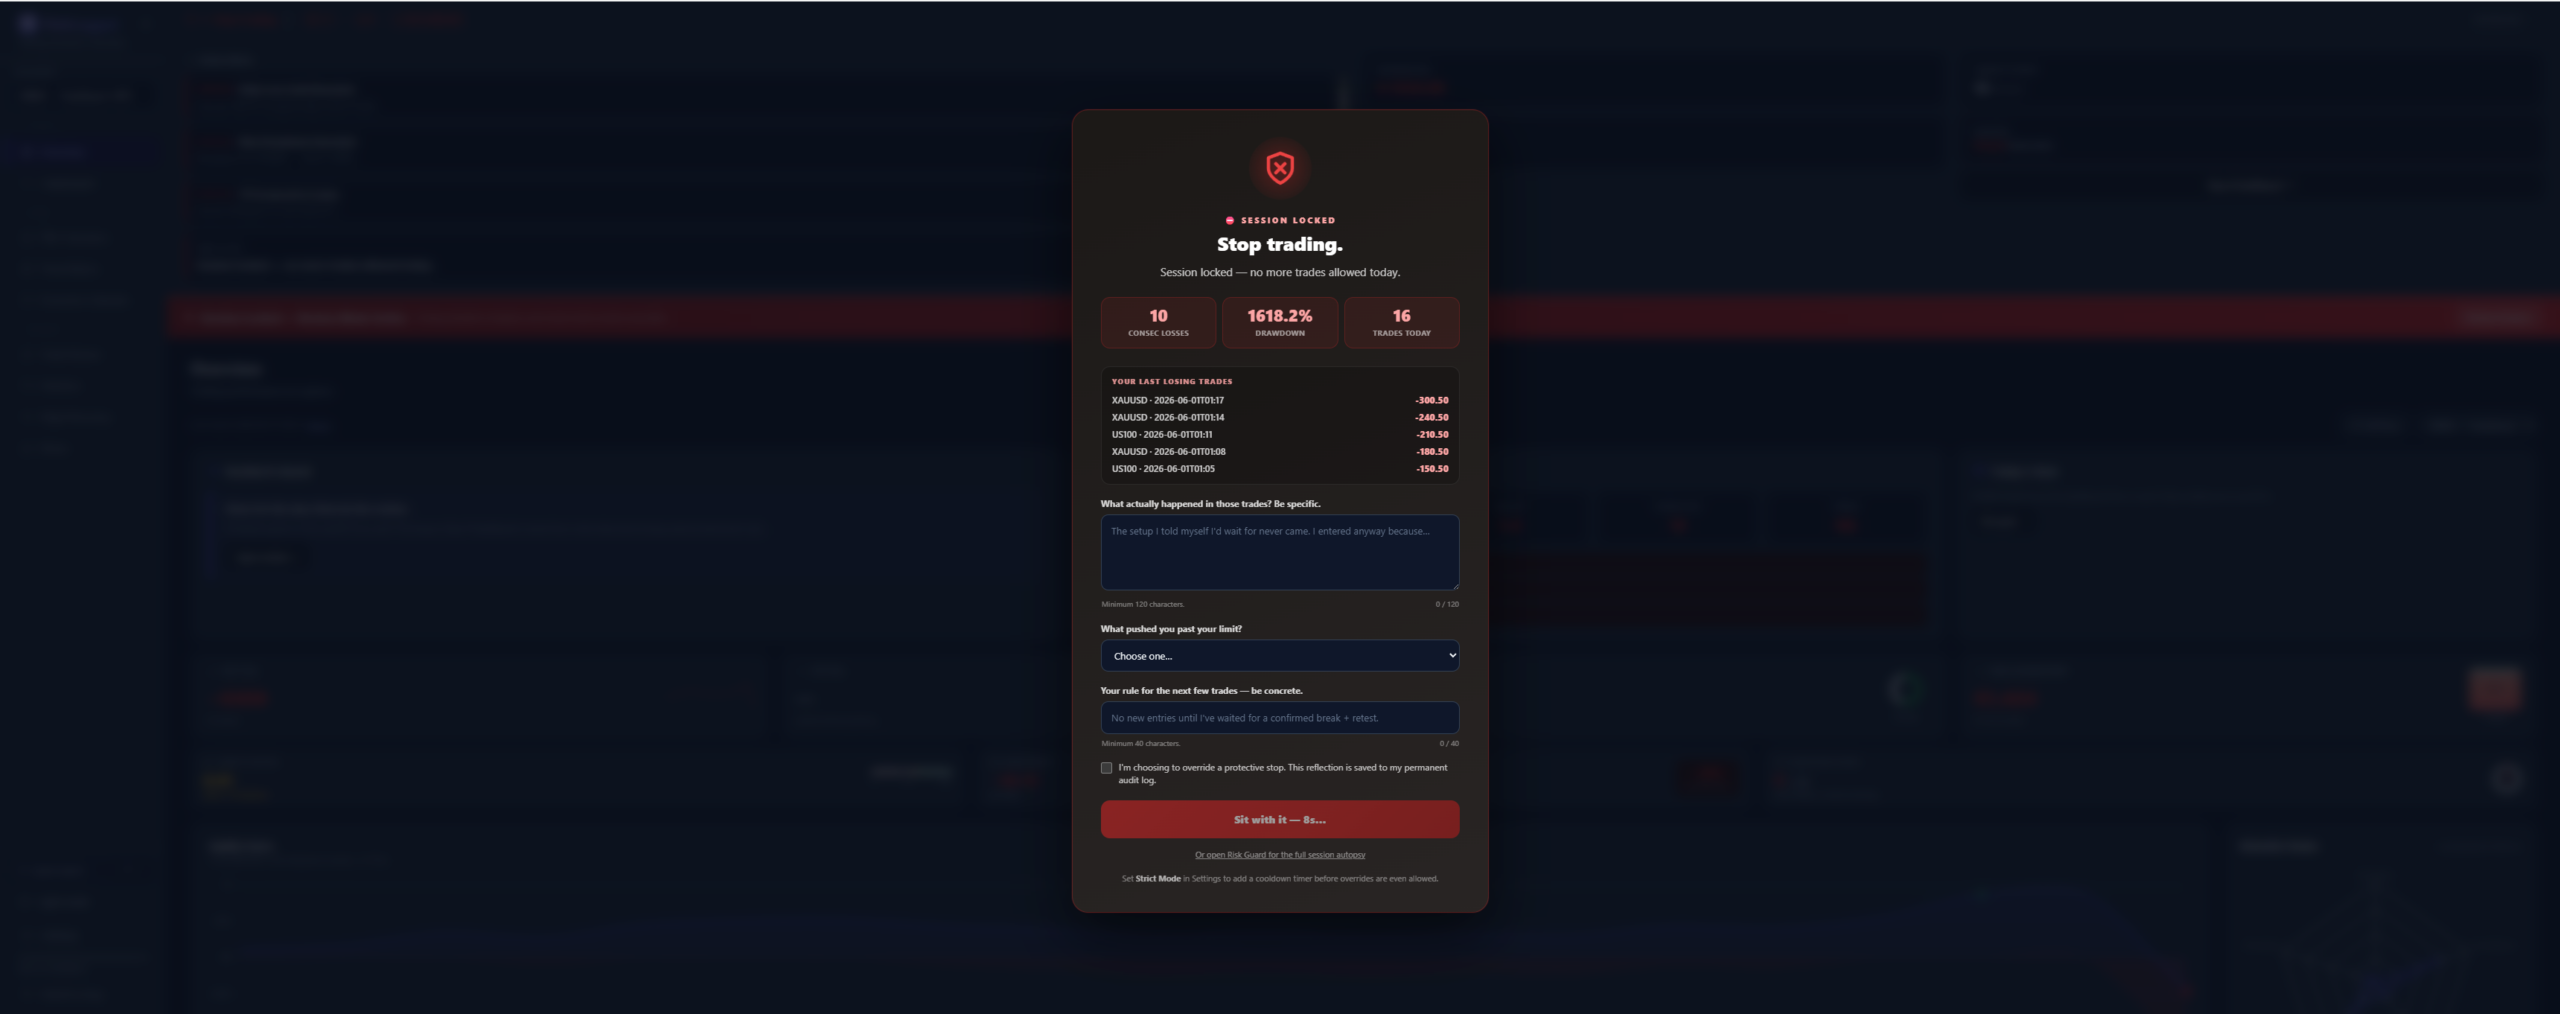
- 01Takes the whole screenThe trade ticket is blocked behind a full-screen stop — you can’t click straight through it.
- 02Names what brokeIt shows exactly which limits you breached, so the reason is impossible to ignore.
- 03Forces a reasonTo continue you write down what you were about to do and why — the pause that breaks the tilt.
- 04Your guardrail, your termsBuilt from the limits you set yourself — strict when you need it, never arbitrary.
TradeGuard — lockdown
When you’re locked, the whole dashboard says so.
Breach a hard limit and it isn’t a quiet note tucked in a corner. Your Overview — the first screen you open — turns into a red lockdown state, so there’s no pretending you didn’t see it.
- 01Red across the topA session-locked banner replaces business-as-usual the moment a hard limit trips.
- 02Right where you look firstIt lives on the Overview — the page you open before every session — not buried in a settings tab.
- 03Still shows the damageEquity curve, P&L and discipline state stay visible, so the cost of the breach is right there with the warning.
- 04Clears on your termsThe lock lifts when your rule says it should — next session, or once the cool-off you set has passed.
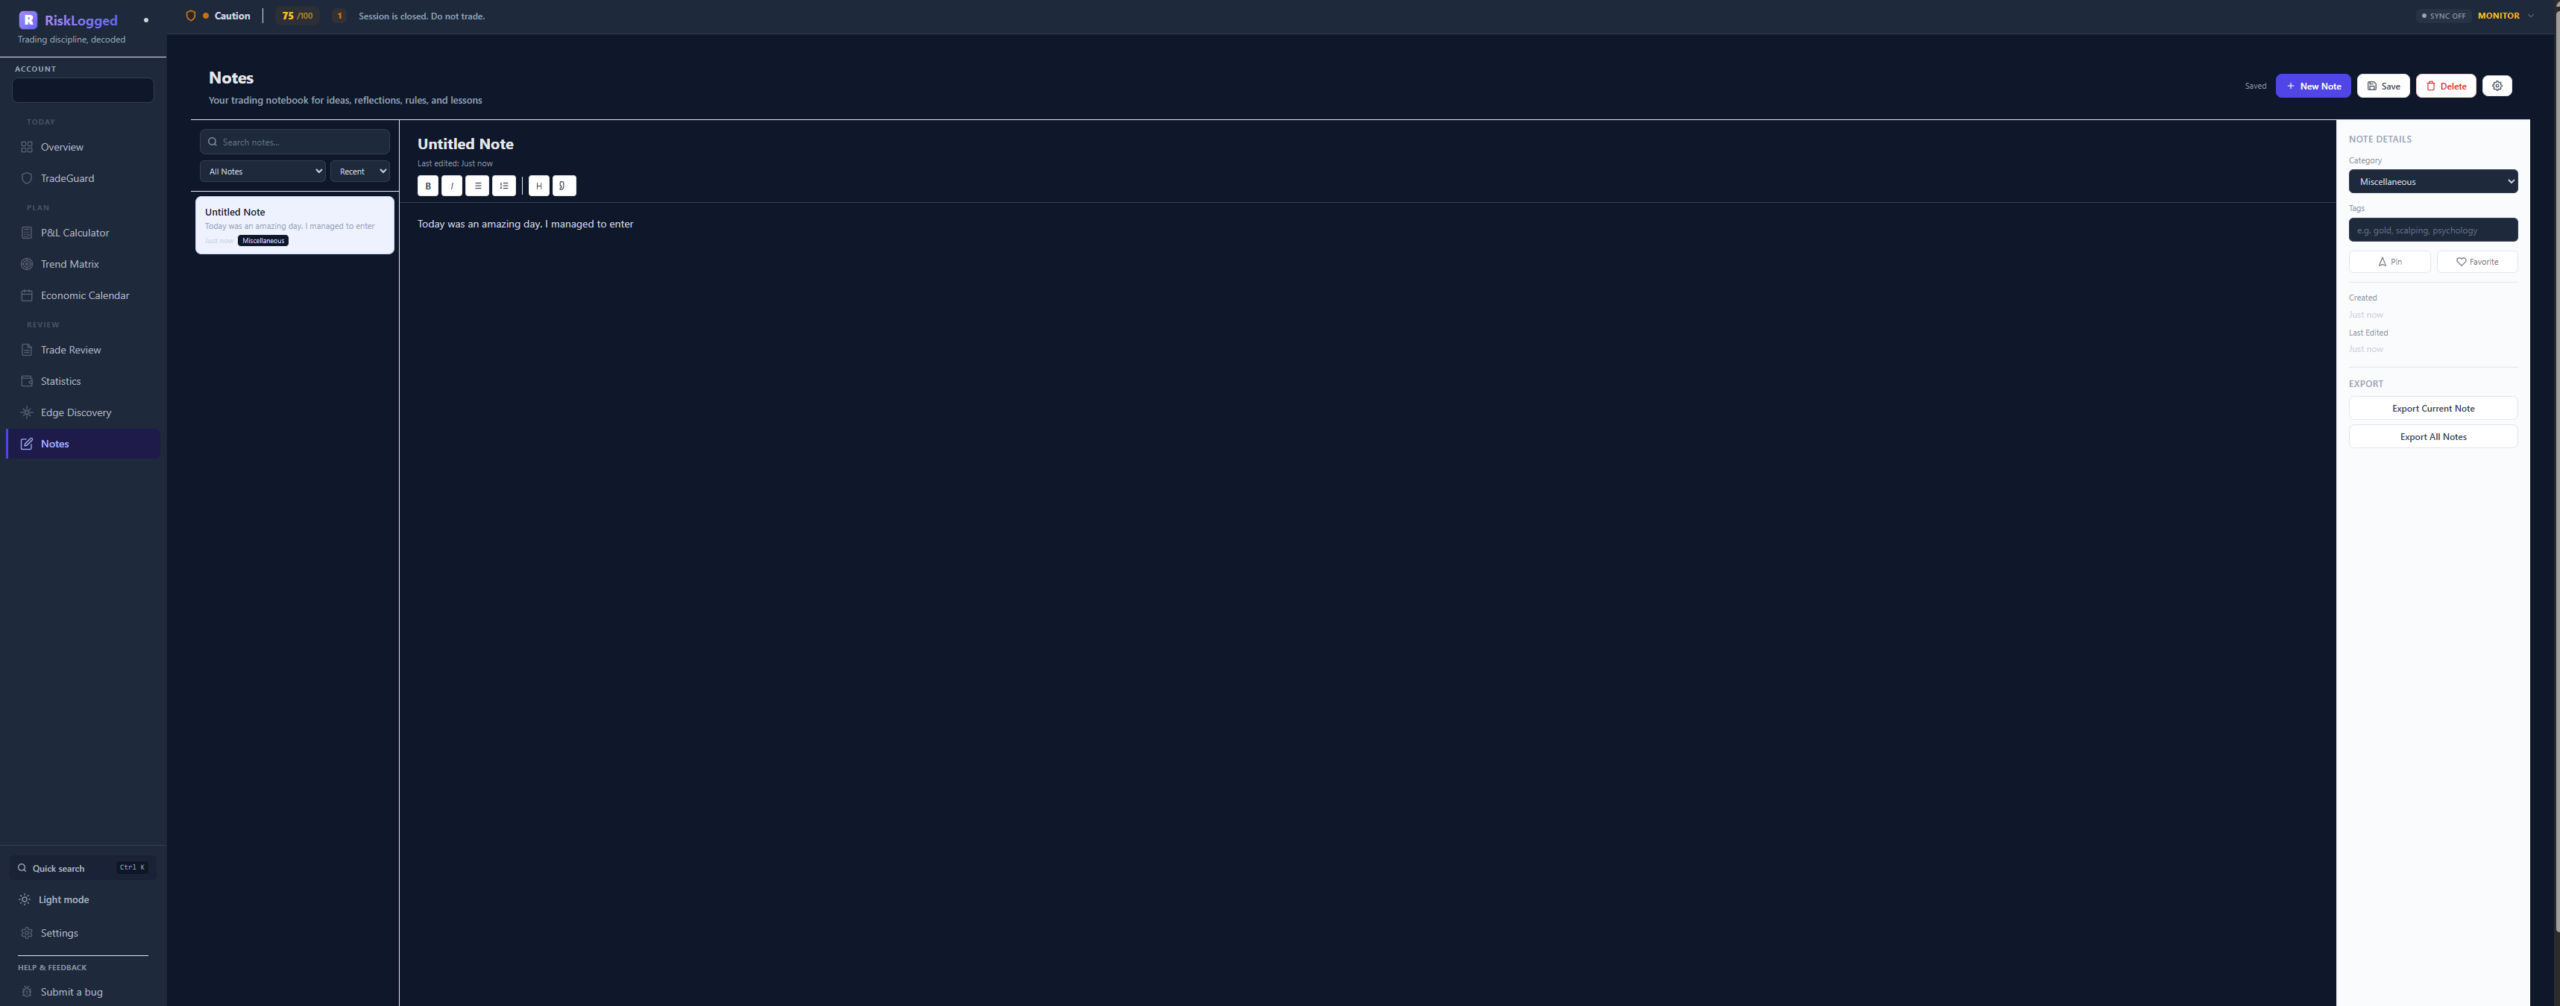
Notes
The journal layer. Where lessons compound.
Pre-trade hypotheses, mid-trade observations, post-trade lessons. Tag them. Search them. Link them back to the exact trade they belong to. The thing you’ll thank yourself for in twelve months.
 01020304
- 01
Notes list
Every note in your account, sorted by date. Pinned notes float to the top — the rules you’re trying to internalize this week.
- 02
Rich editor
Headings, bullets, code, blockquotes. Paste a screenshot inline. Notes are markdown under the hood, fully portable.
- 03
Linked to trades
Drop a note from a Trade Review and it stays attached to that trade forever. Reopen the trade, the note is there.
- 04
Tag & search
Tag a note “revenge” once. Months later, search the tag to see every time you flagged it.
Ready when you are
Trade the journal you keep wishing you had.
Early access
Get on the list.
Access is rolling out in small waves. Drop your email and we’ll get in touch when a seat opens.
Windows + MT5 · Unsubscribe anytime · Privacy policy
FAQ
Common questions.
Who is RiskLogged for?
Does it connect to my broker?
Where does my data live?
What if WXYwaves goes away?
What if I just want a journal, not a gatekeeper?
Will there be a Mac or web version?
How do I get in?
Trading involves risk of loss. RiskLogged is a journaling and discipline tool — not financial advice, not a signal service, and not a guarantee of results. Past behavior does not predict future returns. Always trade with capital you can afford to lose.
Disclaimer: Not Financial Advice
The content provided on WXYwaves is for educational and informational purposes only. It should not be construed as professional financial advice. Trading financial markets involves a high degree of risk and is not suitable for all investors. You could lose some or all of your initial investment.